

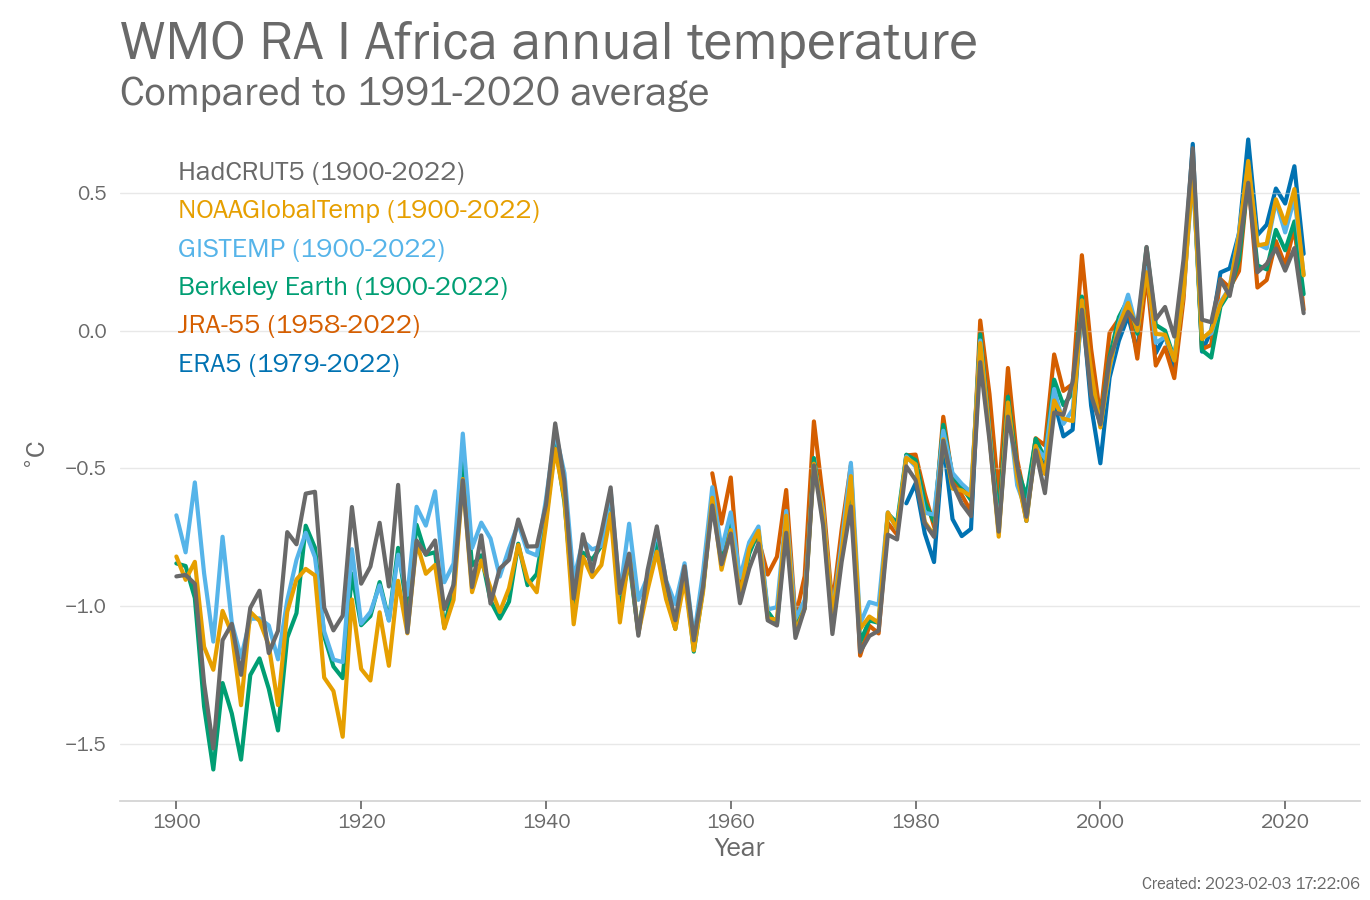
Annual Regional mean temperature for WMO RA 1 Africa (°C, difference from the 1991-2020 average) from 1900-2022. Data are from the following six data sets: Berkeley Earth, ERA5, GISTEMP, HadCRUT5, JRA-55, NOAAGlobalTemp.
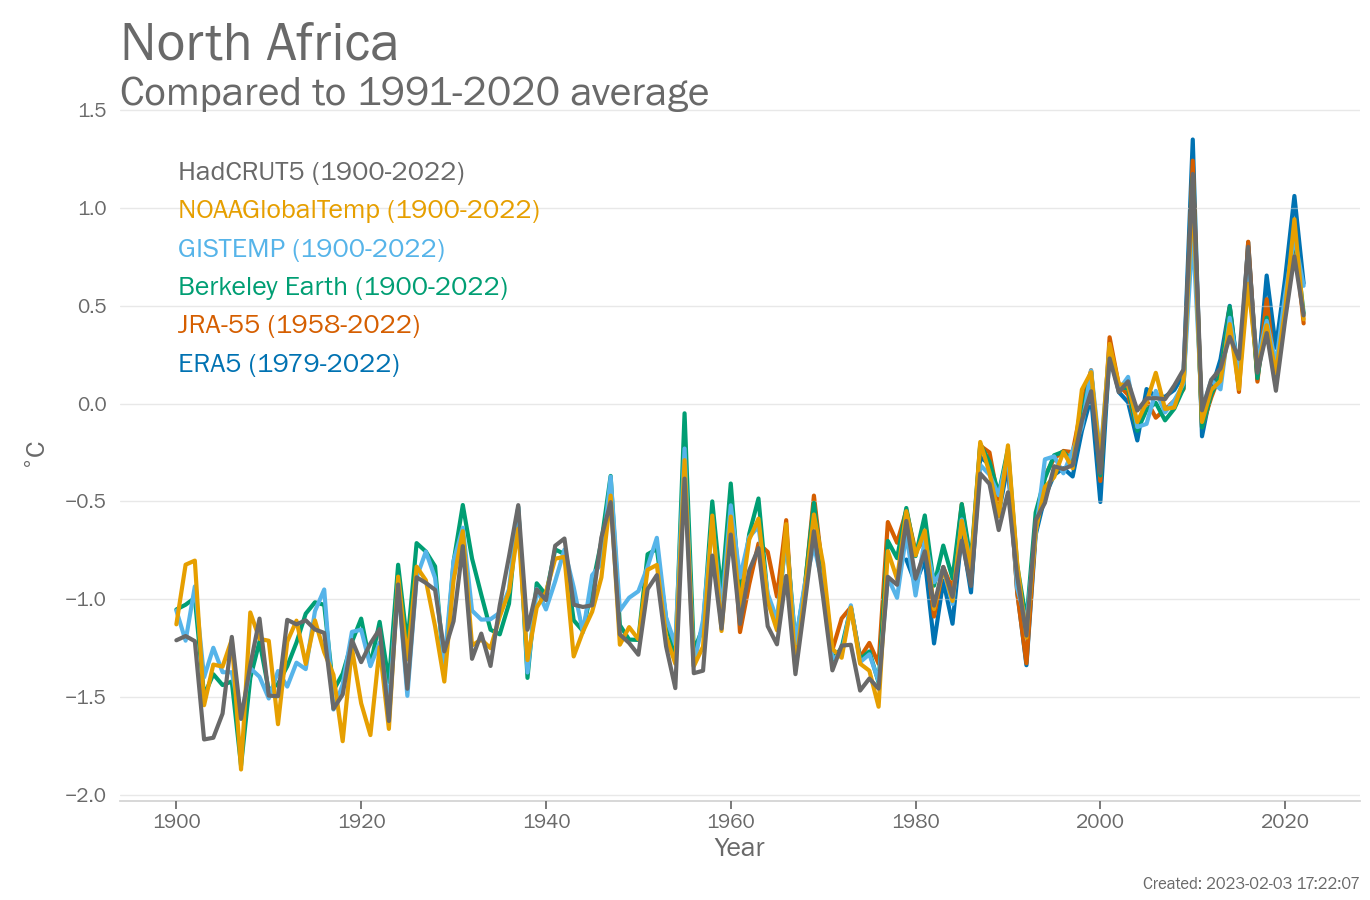
Annual Regional mean temperature for North Africa (°C, difference from the 1991-2020 average) from 1900-2022. Data are from the following six data sets: Berkeley Earth, ERA5, GISTEMP, HadCRUT5, JRA-55, NOAAGlobalTemp.
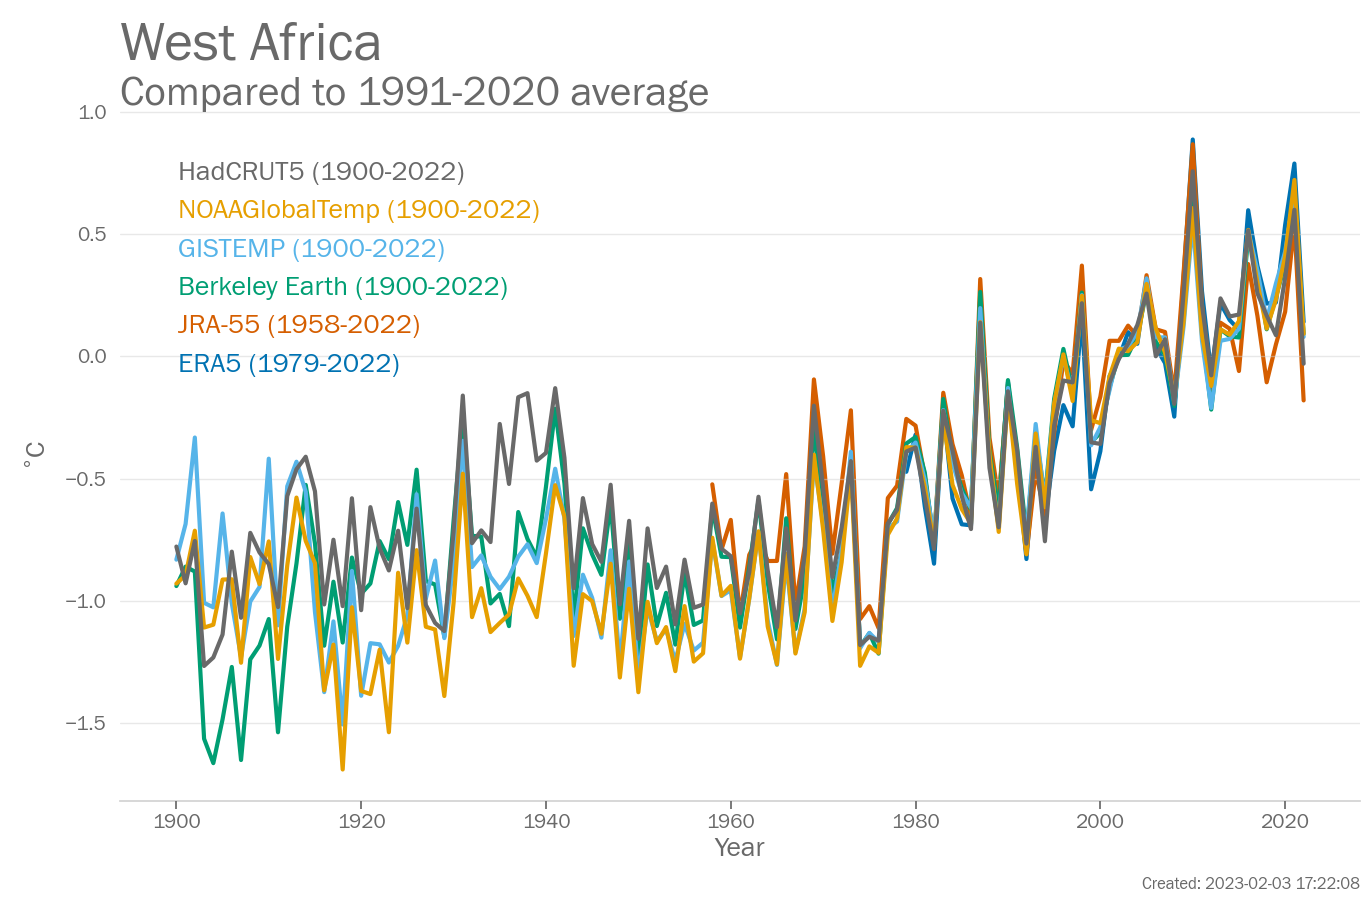
Annual Regional mean temperature for West Africa (°C, difference from the 1991-2020 average) from 1900-2022. Data are from the following six data sets: Berkeley Earth, ERA5, GISTEMP, HadCRUT5, JRA-55, NOAAGlobalTemp.
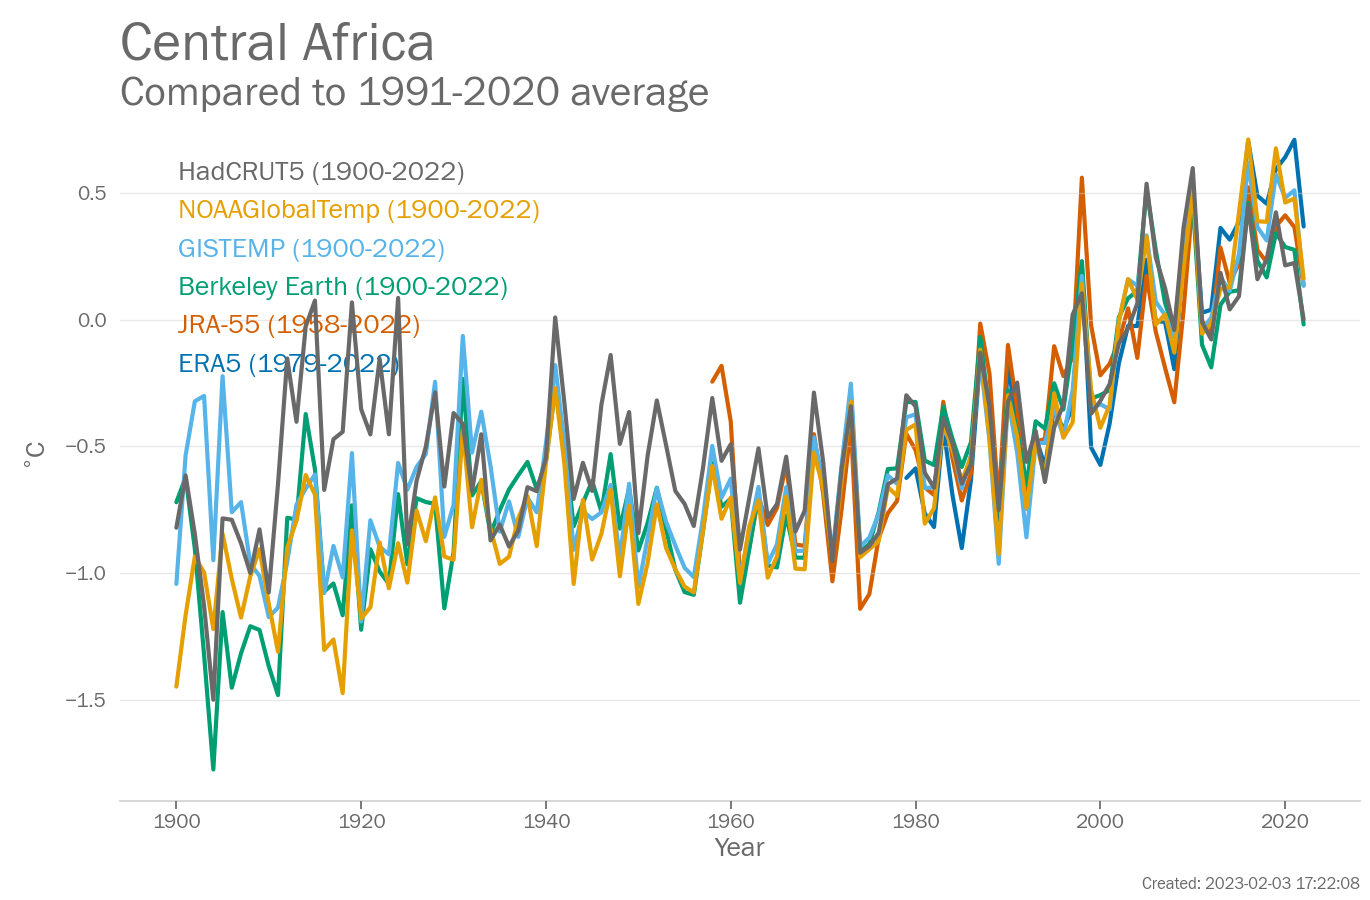
Annual Regional mean temperature for Central Africa (°C, difference from the 1991-2020 average) from 1900-2022. Data are from the following six data sets: Berkeley Earth, ERA5, GISTEMP, HadCRUT5, JRA-55, NOAAGlobalTemp.
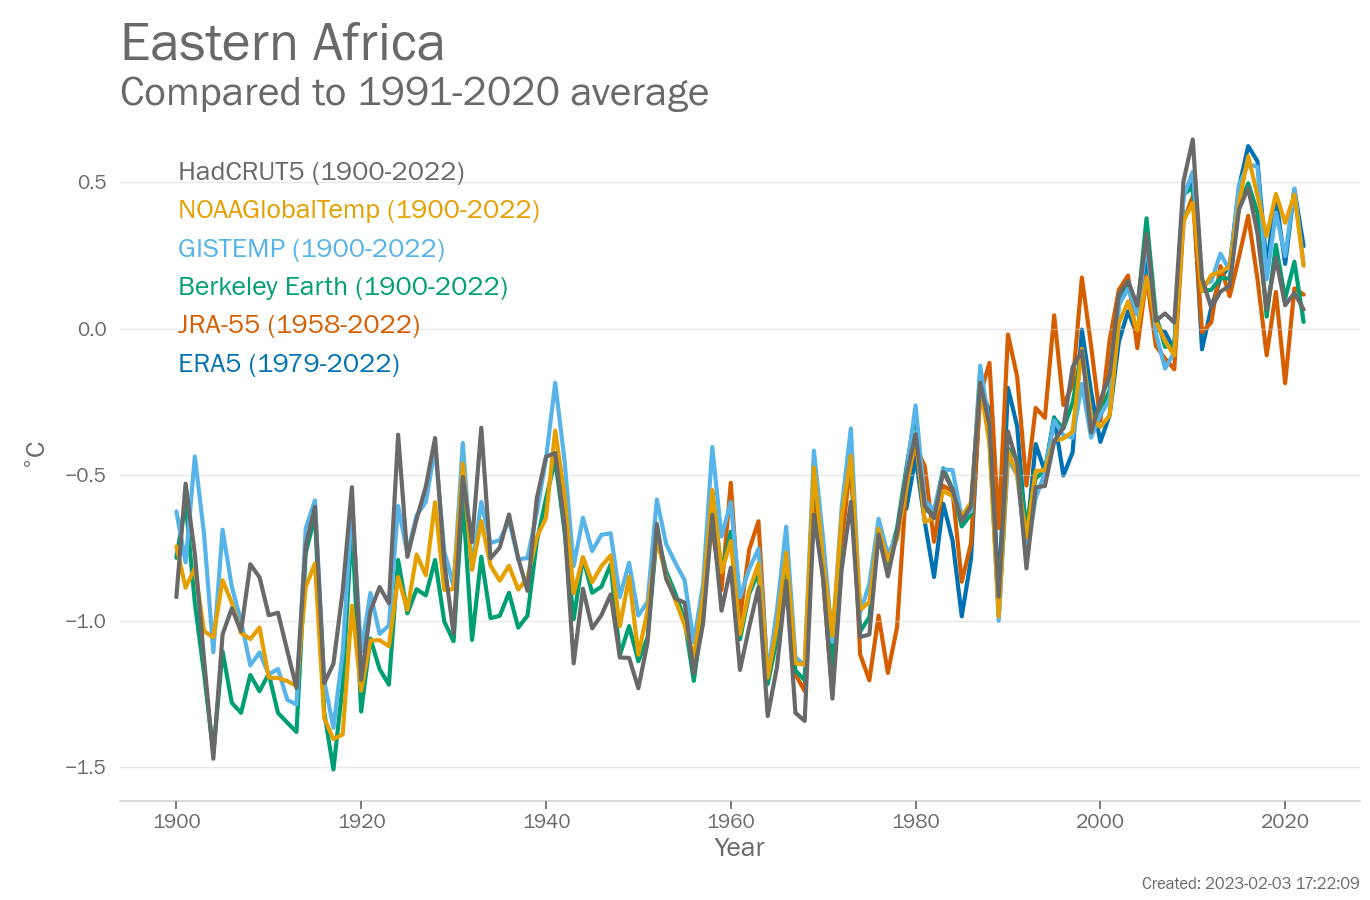
Annual Regional mean temperature for Eastern Africa (°C, difference from the 1991-2020 average) from 1900-2022. Data are from the following six data sets: Berkeley Earth, ERA5, GISTEMP, HadCRUT5, JRA-55, NOAAGlobalTemp.
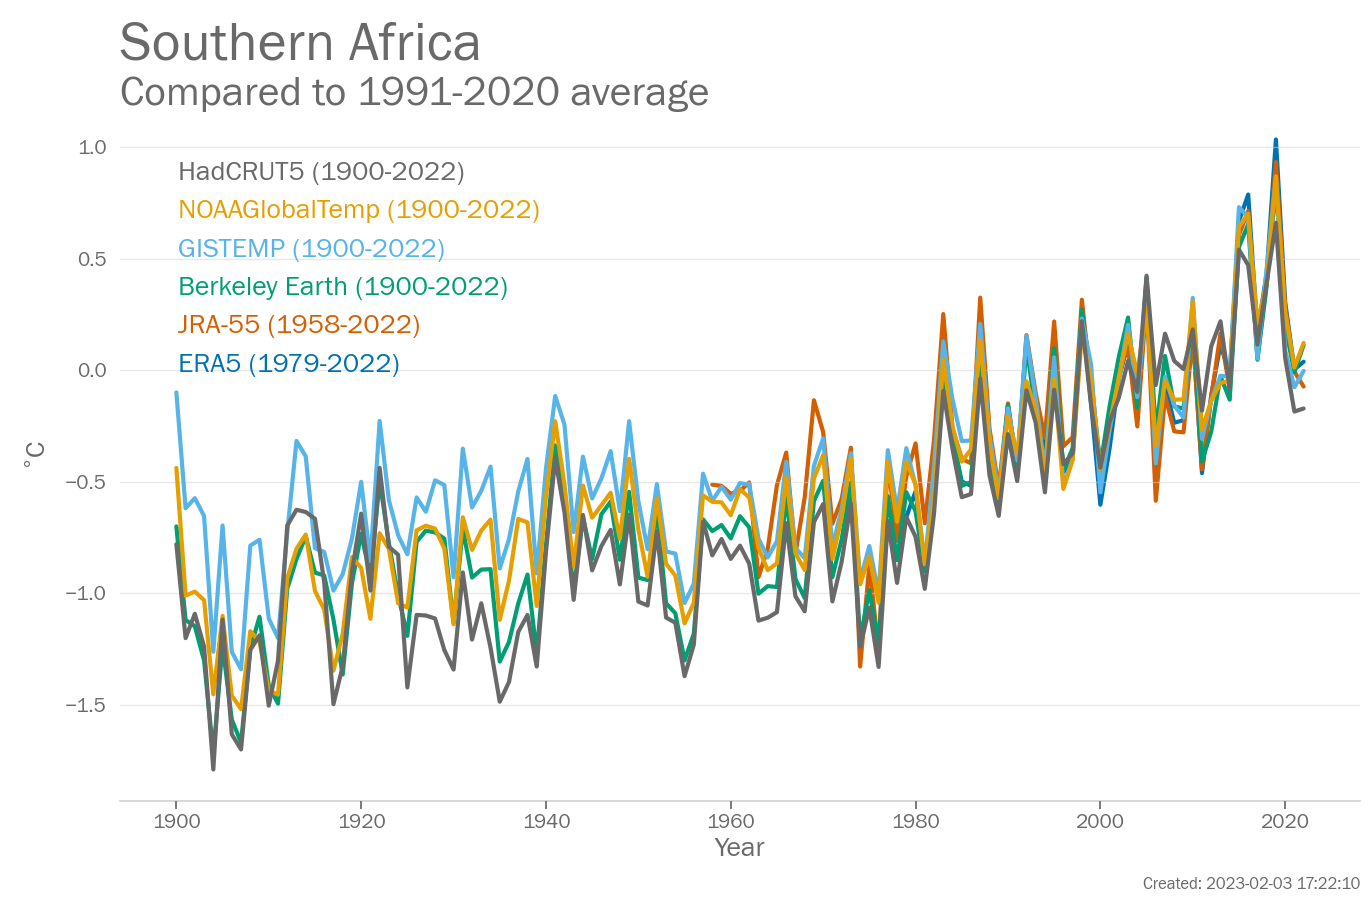
Annual Regional mean temperature for Southern Africa (°C, difference from the 1991-2020 average) from 1900-2022. Data are from the following six data sets: Berkeley Earth, ERA5, GISTEMP, HadCRUT5, JRA-55, NOAAGlobalTemp.
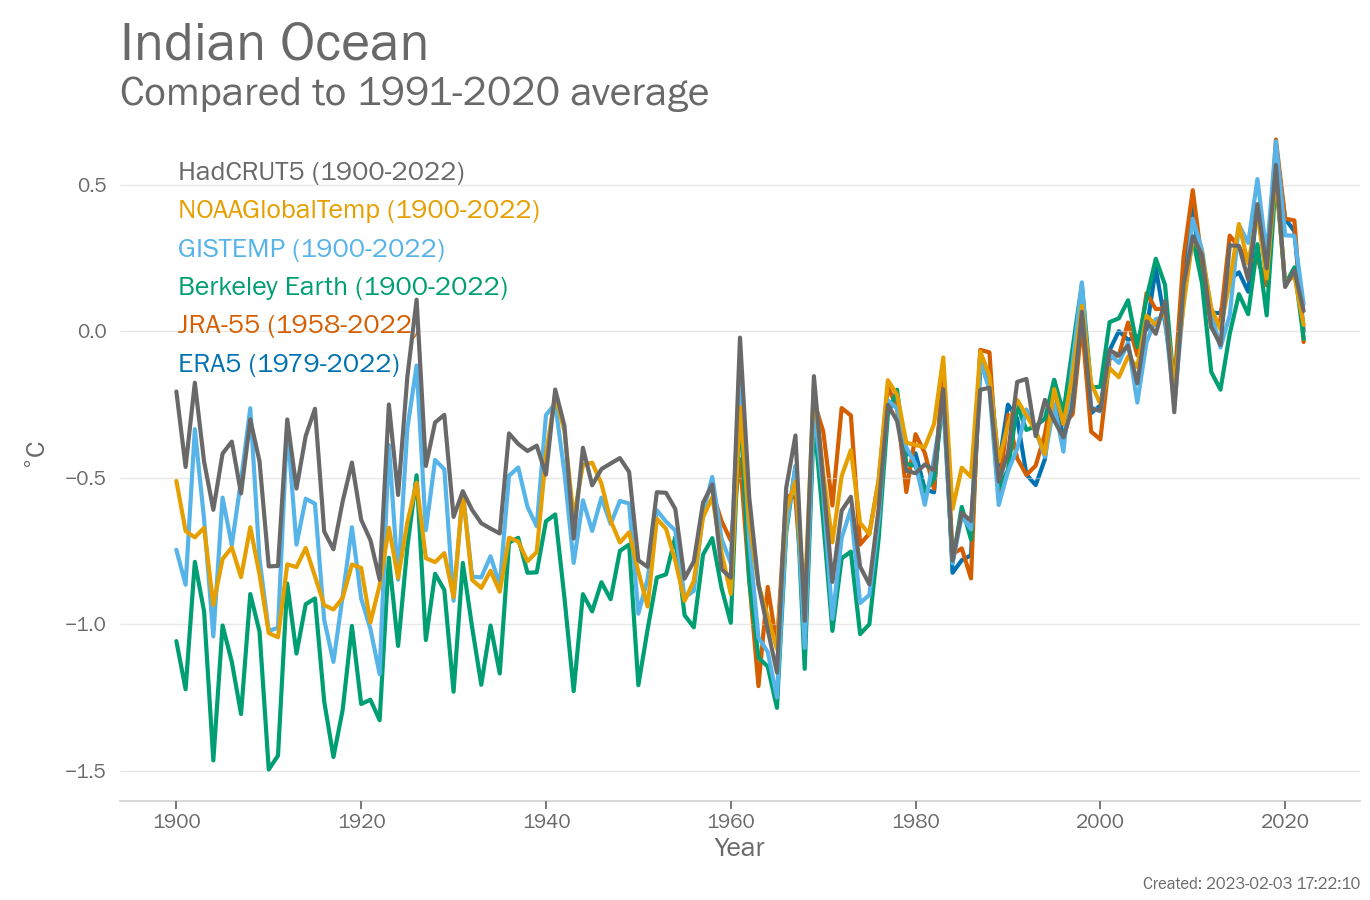
Annual Regional mean temperature for Indian Ocean (°C, difference from the 1991-2020 average) from 1900-2022. Data are from the following six data sets: Berkeley Earth, ERA5, GISTEMP, HadCRUT5, JRA-55, NOAAGlobalTemp.
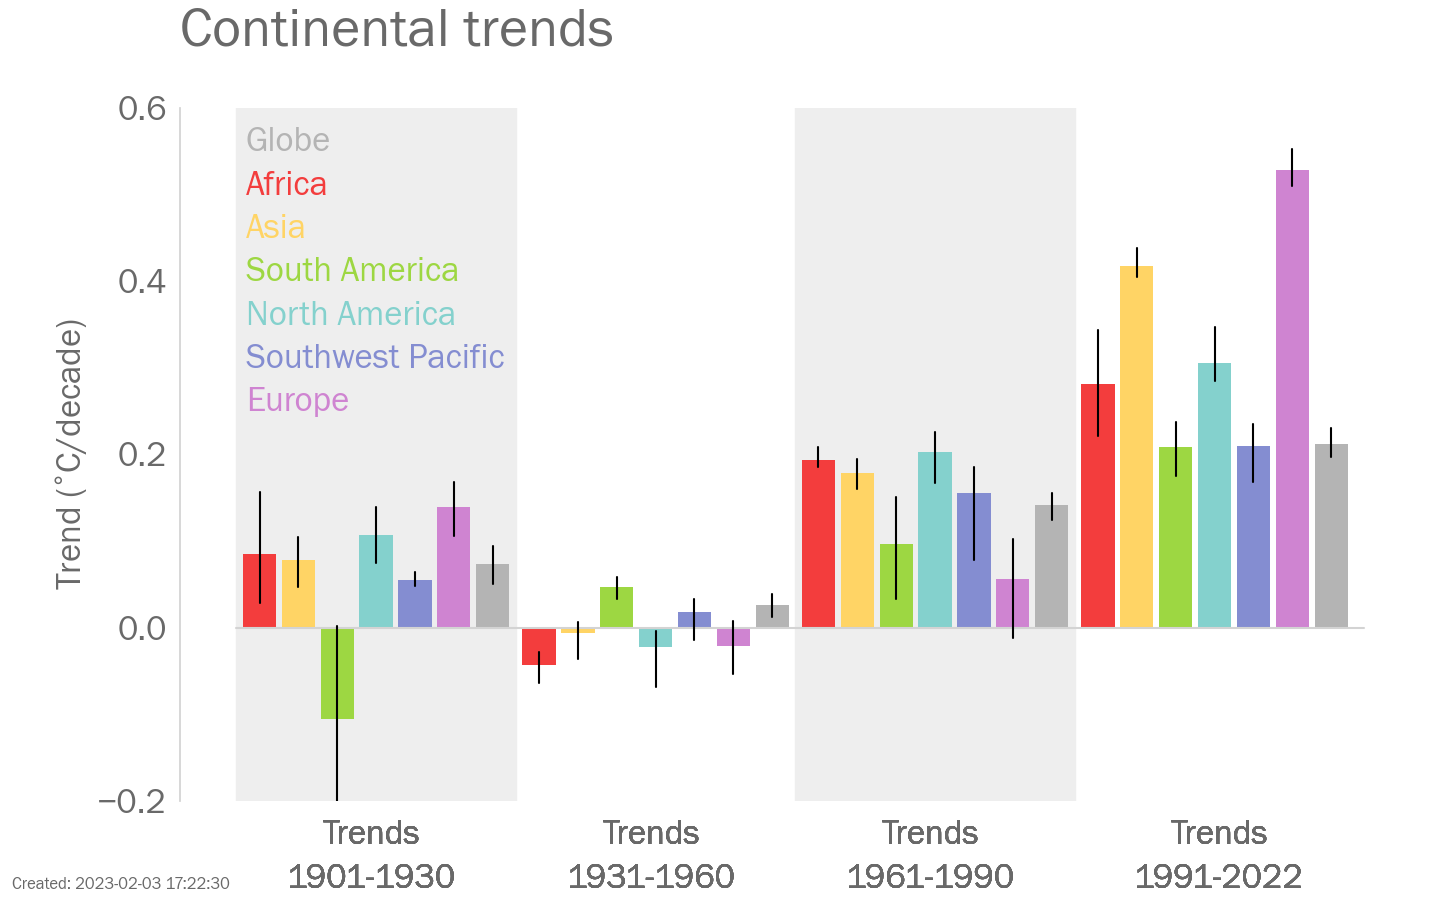
Figure shows the trends for four sub-periods (1901-1930, 1931-1960, 1961-1990 and 1991-2022. Coloured bars show the mean trend for each region and the black vertical lines indicate the range of different estimates.
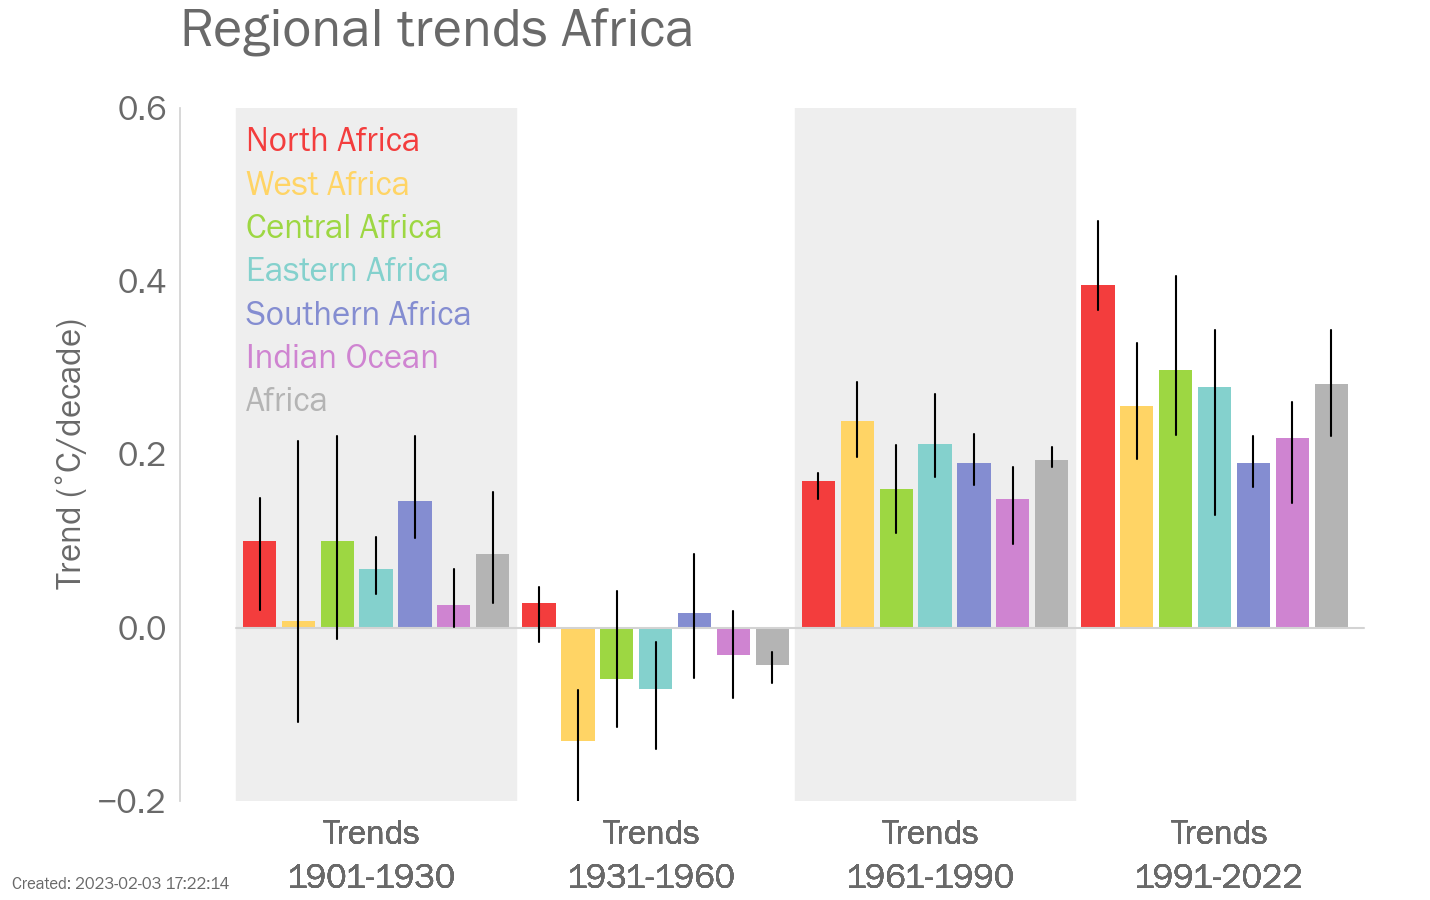
Figure shows the trends for four sub-periods (1901-1930, 1931-1960, 1961-1990 and 1991-2022. Coloured bars show the mean trend for each region and the black vertical lines indicate the range of different estimates.
The year 2022 was ranked between the 9th and 16th highest on record. The mean value for 2022 was 0.16°C relative to the 1991-2020 average (0.06-0.28°C depending on the data set used). 6 data sets were used in this assessment: Berkeley Earth, ERA5, GISTEMP, HadCRUT5, JRA-55, and NOAAGlobalTemp. Relative to a 1961-1990 baseline, the mean value for 2022 was 0.84°C (0.74-0.91°C depending on the data set used). 5 data sets were used in the assessment relative to 1961-1990.
The year 2022 was ranked between the 4th and 7th highest on record. The mean value for 2022 was 0.49°C relative to the 1991-2020 average (0.41-0.61°C depending on the data set used). 6 data sets were used in this assessment: Berkeley Earth, ERA5, GISTEMP, HadCRUT5, JRA-55, and NOAAGlobalTemp. Relative to a 1961-1990 baseline, the mean value for 2022 was 1.34°C (1.24-1.48°C depending on the data set used). 5 data sets were used in the assessment relative to 1961-1990.
The year 2022 was ranked between the 14th and 30th highest on record. The mean value for 2022 was 0.03°C relative to the 1991-2020 average (-0.18-0.14°C depending on the data set used). 6 data sets were used in this assessment: Berkeley Earth, ERA5, GISTEMP, HadCRUT5, JRA-55, and NOAAGlobalTemp. Relative to a 1961-1990 baseline, the mean value for 2022 was 0.68°C (0.39-0.83°C depending on the data set used). 5 data sets were used in the assessment relative to 1961-1990.
The year 2022 was ranked between the 9th and 22nd highest on record. The mean value for 2022 was 0.13°C relative to the 1991-2020 average (-0.02-0.37°C depending on the data set used). 6 data sets were used in this assessment: Berkeley Earth, ERA5, GISTEMP, HadCRUT5, JRA-55, and NOAAGlobalTemp. Relative to a 1961-1990 baseline, the mean value for 2022 was 0.73°C (0.60-0.85°C depending on the data set used). 5 data sets were used in the assessment relative to 1961-1990.
The year 2022 was ranked between the 8th and 19th highest on record. The mean value for 2022 was 0.15°C relative to the 1991-2020 average (0.02-0.28°C depending on the data set used). 6 data sets were used in this assessment: Berkeley Earth, ERA5, GISTEMP, HadCRUT5, JRA-55, and NOAAGlobalTemp. Relative to a 1961-1990 baseline, the mean value for 2022 was 0.87°C (0.76-0.95°C depending on the data set used). 5 data sets were used in the assessment relative to 1961-1990.
The year 2022 was ranked between the 10th and 25th highest on record. The mean value for 2022 was 0.00°C relative to the 1991-2020 average (-0.17-0.12°C depending on the data set used). 6 data sets were used in this assessment: Berkeley Earth, ERA5, GISTEMP, HadCRUT5, JRA-55, and NOAAGlobalTemp. Relative to a 1961-1990 baseline, the mean value for 2022 was 0.60°C (0.42-0.78°C depending on the data set used). 5 data sets were used in the assessment relative to 1961-1990.
The year 2022 was ranked between the 12th and 19th highest on record. The mean value for 2022 was 0.02°C relative to the 1991-2020 average (-0.04-0.09°C depending on the data set used). 6 data sets were used in this assessment: Berkeley Earth, ERA5, GISTEMP, HadCRUT5, JRA-55, and NOAAGlobalTemp. Relative to a 1961-1990 baseline, the mean value for 2022 was 0.59°C (0.49-0.69°C depending on the data set used). 5 data sets were used in the assessment relative to 1961-1990.
The data in the above plot are available in a zip file containing a csv file for each data set.
Data file: WMO_RA_I_Africa_data_files.zip
Checksum: f0092259d11d61affd5067b9b71b8140
Format: BADC CSV format
Original data file (external link)
To produce the plot, the following processing steps were performed:
Original data file (external link)
To produce the plot, the following processing steps were performed:
Original data file (external link)
Data citation: GISTEMP Team, 2022: GISS Surface Temperature Analysis (GISTEMP), version 4. NASA Goddard Institute for Space Studies. Dataset accessed 2023-02-02 09:18:24 at data.giss.nasa.gov/gistemp/.
To produce the plot, the following processing steps were performed:
Original data file (external link)
Acknowledgement: HadCRUT.5.0.1.0 data were obtained from http://www.metoffice.gov.uk/hadobs/hadcrut5 on 2023-02-02 09:18:25 and are © British Crown Copyright, Met Office 2023, provided under an Open Government License, http://www.nationalarchives.gov.uk/doc/open-government-licence/version/3/
To produce the plot, the following processing steps were performed:
Original data file (external link)
To produce the plot, the following processing steps were performed:
Original data file (external link)
Citations: Huang, B., M. J. Menne, T. Boyer, E. Freeman, B. E. Gleason, J. H. Lawrimore, C. Liu, J. J. Rennie, C. Schreck, F. Sun, R. Vose, C. N. Williams, X. Yin, H.-M. Zhang, 2020: Uncertainty estimates for sea surface temperature and land surface air temperature in NOAAGlobalTemp version 5. , J. Climate, 33, 1351-1379, DOI: 10.1175/JCLI-D-19-0395.1. Zhang, Huai-Min, Jay H. Lawrimore, Boyin Huang, Matthew J. Menne, Xungang Yin, Ahira Sȧnchez-Lugo, Byron E. Gleason, Russell Vose, Derek Arndt, J. Jared Rennie, and Claude N. Williams. (2019) Updated Temperature Data Give a Sharper View of Climate Trends. Eos, 100, https://doi.org/10.1029/2019EO128229.
Data citation: Zhang, H.-M., B. Huang, J. Lawrimore, M. Menne, Thomas M. Smith, NOAA Global Surface Temperature Dataset (NOAAGlobalTemp), Version 5 [indicate subset used]. NOAA National Centers for Environmental Information. doi:10.25921/9qth-2p70 Accessed [2023-02-02 09:18:32].
To produce the plot, the following processing steps were performed:
The data in the above plot are available in a zip file containing a csv file for each data set.
Data file: North_Africa_data_files.zip
Checksum: d43339afce7d4c300960f2b339099f4b
Format: BADC CSV format
Original data file (external link)
To produce the plot, the following processing steps were performed:
Original data file (external link)
To produce the plot, the following processing steps were performed:
Original data file (external link)
Data citation: GISTEMP Team, 2022: GISS Surface Temperature Analysis (GISTEMP), version 4. NASA Goddard Institute for Space Studies. Dataset accessed 2023-02-02 09:18:24 at data.giss.nasa.gov/gistemp/.
To produce the plot, the following processing steps were performed:
Original data file (external link)
Acknowledgement: HadCRUT.5.0.1.0 data were obtained from http://www.metoffice.gov.uk/hadobs/hadcrut5 on 2023-02-02 09:18:25 and are © British Crown Copyright, Met Office 2023, provided under an Open Government License, http://www.nationalarchives.gov.uk/doc/open-government-licence/version/3/
To produce the plot, the following processing steps were performed:
Original data file (external link)
To produce the plot, the following processing steps were performed:
Original data file (external link)
Citations: Huang, B., M. J. Menne, T. Boyer, E. Freeman, B. E. Gleason, J. H. Lawrimore, C. Liu, J. J. Rennie, C. Schreck, F. Sun, R. Vose, C. N. Williams, X. Yin, H.-M. Zhang, 2020: Uncertainty estimates for sea surface temperature and land surface air temperature in NOAAGlobalTemp version 5. , J. Climate, 33, 1351-1379, DOI: 10.1175/JCLI-D-19-0395.1. Zhang, Huai-Min, Jay H. Lawrimore, Boyin Huang, Matthew J. Menne, Xungang Yin, Ahira Sȧnchez-Lugo, Byron E. Gleason, Russell Vose, Derek Arndt, J. Jared Rennie, and Claude N. Williams. (2019) Updated Temperature Data Give a Sharper View of Climate Trends. Eos, 100, https://doi.org/10.1029/2019EO128229.
Data citation: Zhang, H.-M., B. Huang, J. Lawrimore, M. Menne, Thomas M. Smith, NOAA Global Surface Temperature Dataset (NOAAGlobalTemp), Version 5 [indicate subset used]. NOAA National Centers for Environmental Information. doi:10.25921/9qth-2p70 Accessed [2023-02-02 09:18:32].
To produce the plot, the following processing steps were performed:
The data in the above plot are available in a zip file containing a csv file for each data set.
Data file: West_Africa_data_files.zip
Checksum: 0f8b692525fd46e25f5b776b7fe1f6cb
Format: BADC CSV format
Original data file (external link)
To produce the plot, the following processing steps were performed:
Original data file (external link)
To produce the plot, the following processing steps were performed:
Original data file (external link)
Data citation: GISTEMP Team, 2022: GISS Surface Temperature Analysis (GISTEMP), version 4. NASA Goddard Institute for Space Studies. Dataset accessed 2023-02-02 09:18:24 at data.giss.nasa.gov/gistemp/.
To produce the plot, the following processing steps were performed:
Original data file (external link)
Acknowledgement: HadCRUT.5.0.1.0 data were obtained from http://www.metoffice.gov.uk/hadobs/hadcrut5 on 2023-02-02 09:18:25 and are © British Crown Copyright, Met Office 2023, provided under an Open Government License, http://www.nationalarchives.gov.uk/doc/open-government-licence/version/3/
To produce the plot, the following processing steps were performed:
Original data file (external link)
To produce the plot, the following processing steps were performed:
Original data file (external link)
Citations: Huang, B., M. J. Menne, T. Boyer, E. Freeman, B. E. Gleason, J. H. Lawrimore, C. Liu, J. J. Rennie, C. Schreck, F. Sun, R. Vose, C. N. Williams, X. Yin, H.-M. Zhang, 2020: Uncertainty estimates for sea surface temperature and land surface air temperature in NOAAGlobalTemp version 5. , J. Climate, 33, 1351-1379, DOI: 10.1175/JCLI-D-19-0395.1. Zhang, Huai-Min, Jay H. Lawrimore, Boyin Huang, Matthew J. Menne, Xungang Yin, Ahira Sȧnchez-Lugo, Byron E. Gleason, Russell Vose, Derek Arndt, J. Jared Rennie, and Claude N. Williams. (2019) Updated Temperature Data Give a Sharper View of Climate Trends. Eos, 100, https://doi.org/10.1029/2019EO128229.
Data citation: Zhang, H.-M., B. Huang, J. Lawrimore, M. Menne, Thomas M. Smith, NOAA Global Surface Temperature Dataset (NOAAGlobalTemp), Version 5 [indicate subset used]. NOAA National Centers for Environmental Information. doi:10.25921/9qth-2p70 Accessed [2023-02-02 09:18:32].
To produce the plot, the following processing steps were performed:
The data in the above plot are available in a zip file containing a csv file for each data set.
Data file: Central_Africa_data_files.zip
Checksum: 7ad288f1a35ac413f04e56a8d6f565ca
Format: BADC CSV format
Original data file (external link)
To produce the plot, the following processing steps were performed:
Original data file (external link)
To produce the plot, the following processing steps were performed:
Original data file (external link)
Data citation: GISTEMP Team, 2022: GISS Surface Temperature Analysis (GISTEMP), version 4. NASA Goddard Institute for Space Studies. Dataset accessed 2023-02-02 09:18:24 at data.giss.nasa.gov/gistemp/.
To produce the plot, the following processing steps were performed:
Original data file (external link)
Acknowledgement: HadCRUT.5.0.1.0 data were obtained from http://www.metoffice.gov.uk/hadobs/hadcrut5 on 2023-02-02 09:18:25 and are © British Crown Copyright, Met Office 2023, provided under an Open Government License, http://www.nationalarchives.gov.uk/doc/open-government-licence/version/3/
To produce the plot, the following processing steps were performed:
Original data file (external link)
To produce the plot, the following processing steps were performed:
Original data file (external link)
Citations: Huang, B., M. J. Menne, T. Boyer, E. Freeman, B. E. Gleason, J. H. Lawrimore, C. Liu, J. J. Rennie, C. Schreck, F. Sun, R. Vose, C. N. Williams, X. Yin, H.-M. Zhang, 2020: Uncertainty estimates for sea surface temperature and land surface air temperature in NOAAGlobalTemp version 5. , J. Climate, 33, 1351-1379, DOI: 10.1175/JCLI-D-19-0395.1. Zhang, Huai-Min, Jay H. Lawrimore, Boyin Huang, Matthew J. Menne, Xungang Yin, Ahira Sȧnchez-Lugo, Byron E. Gleason, Russell Vose, Derek Arndt, J. Jared Rennie, and Claude N. Williams. (2019) Updated Temperature Data Give a Sharper View of Climate Trends. Eos, 100, https://doi.org/10.1029/2019EO128229.
Data citation: Zhang, H.-M., B. Huang, J. Lawrimore, M. Menne, Thomas M. Smith, NOAA Global Surface Temperature Dataset (NOAAGlobalTemp), Version 5 [indicate subset used]. NOAA National Centers for Environmental Information. doi:10.25921/9qth-2p70 Accessed [2023-02-02 09:18:32].
To produce the plot, the following processing steps were performed:
The data in the above plot are available in a zip file containing a csv file for each data set.
Data file: Eastern_Africa_data_files.zip
Checksum: d4cf7f48e14ad852f92f2fecf439c2c2
Format: BADC CSV format
Original data file (external link)
To produce the plot, the following processing steps were performed:
Original data file (external link)
To produce the plot, the following processing steps were performed:
Original data file (external link)
Data citation: GISTEMP Team, 2022: GISS Surface Temperature Analysis (GISTEMP), version 4. NASA Goddard Institute for Space Studies. Dataset accessed 2023-02-02 09:18:24 at data.giss.nasa.gov/gistemp/.
To produce the plot, the following processing steps were performed:
Original data file (external link)
Acknowledgement: HadCRUT.5.0.1.0 data were obtained from http://www.metoffice.gov.uk/hadobs/hadcrut5 on 2023-02-02 09:18:25 and are © British Crown Copyright, Met Office 2023, provided under an Open Government License, http://www.nationalarchives.gov.uk/doc/open-government-licence/version/3/
To produce the plot, the following processing steps were performed:
Original data file (external link)
To produce the plot, the following processing steps were performed:
Original data file (external link)
Citations: Huang, B., M. J. Menne, T. Boyer, E. Freeman, B. E. Gleason, J. H. Lawrimore, C. Liu, J. J. Rennie, C. Schreck, F. Sun, R. Vose, C. N. Williams, X. Yin, H.-M. Zhang, 2020: Uncertainty estimates for sea surface temperature and land surface air temperature in NOAAGlobalTemp version 5. , J. Climate, 33, 1351-1379, DOI: 10.1175/JCLI-D-19-0395.1. Zhang, Huai-Min, Jay H. Lawrimore, Boyin Huang, Matthew J. Menne, Xungang Yin, Ahira Sȧnchez-Lugo, Byron E. Gleason, Russell Vose, Derek Arndt, J. Jared Rennie, and Claude N. Williams. (2019) Updated Temperature Data Give a Sharper View of Climate Trends. Eos, 100, https://doi.org/10.1029/2019EO128229.
Data citation: Zhang, H.-M., B. Huang, J. Lawrimore, M. Menne, Thomas M. Smith, NOAA Global Surface Temperature Dataset (NOAAGlobalTemp), Version 5 [indicate subset used]. NOAA National Centers for Environmental Information. doi:10.25921/9qth-2p70 Accessed [2023-02-02 09:18:32].
To produce the plot, the following processing steps were performed:
The data in the above plot are available in a zip file containing a csv file for each data set.
Data file: Southern_Africa_data_files.zip
Checksum: 54e91d6feb13f2c09a4210d9d709c839
Format: BADC CSV format
Original data file (external link)
To produce the plot, the following processing steps were performed:
Original data file (external link)
To produce the plot, the following processing steps were performed:
Original data file (external link)
Data citation: GISTEMP Team, 2022: GISS Surface Temperature Analysis (GISTEMP), version 4. NASA Goddard Institute for Space Studies. Dataset accessed 2023-02-02 09:18:24 at data.giss.nasa.gov/gistemp/.
To produce the plot, the following processing steps were performed:
Original data file (external link)
Acknowledgement: HadCRUT.5.0.1.0 data were obtained from http://www.metoffice.gov.uk/hadobs/hadcrut5 on 2023-02-02 09:18:25 and are © British Crown Copyright, Met Office 2023, provided under an Open Government License, http://www.nationalarchives.gov.uk/doc/open-government-licence/version/3/
To produce the plot, the following processing steps were performed:
Original data file (external link)
To produce the plot, the following processing steps were performed:
Original data file (external link)
Citations: Huang, B., M. J. Menne, T. Boyer, E. Freeman, B. E. Gleason, J. H. Lawrimore, C. Liu, J. J. Rennie, C. Schreck, F. Sun, R. Vose, C. N. Williams, X. Yin, H.-M. Zhang, 2020: Uncertainty estimates for sea surface temperature and land surface air temperature in NOAAGlobalTemp version 5. , J. Climate, 33, 1351-1379, DOI: 10.1175/JCLI-D-19-0395.1. Zhang, Huai-Min, Jay H. Lawrimore, Boyin Huang, Matthew J. Menne, Xungang Yin, Ahira Sȧnchez-Lugo, Byron E. Gleason, Russell Vose, Derek Arndt, J. Jared Rennie, and Claude N. Williams. (2019) Updated Temperature Data Give a Sharper View of Climate Trends. Eos, 100, https://doi.org/10.1029/2019EO128229.
Data citation: Zhang, H.-M., B. Huang, J. Lawrimore, M. Menne, Thomas M. Smith, NOAA Global Surface Temperature Dataset (NOAAGlobalTemp), Version 5 [indicate subset used]. NOAA National Centers for Environmental Information. doi:10.25921/9qth-2p70 Accessed [2023-02-02 09:18:32].
To produce the plot, the following processing steps were performed:
The data in the above plot are available in a zip file containing a csv file for each data set.
Data file: Indian_Ocean_data_files.zip
Checksum: 641e7b972a4376d7a1190597f82c4703
Format: BADC CSV format
Original data file (external link)
To produce the plot, the following processing steps were performed:
Original data file (external link)
To produce the plot, the following processing steps were performed:
Original data file (external link)
Data citation: GISTEMP Team, 2022: GISS Surface Temperature Analysis (GISTEMP), version 4. NASA Goddard Institute for Space Studies. Dataset accessed 2023-02-02 09:18:24 at data.giss.nasa.gov/gistemp/.
To produce the plot, the following processing steps were performed:
Original data file (external link)
Acknowledgement: HadCRUT.5.0.1.0 data were obtained from http://www.metoffice.gov.uk/hadobs/hadcrut5 on 2023-02-02 09:18:25 and are © British Crown Copyright, Met Office 2023, provided under an Open Government License, http://www.nationalarchives.gov.uk/doc/open-government-licence/version/3/
To produce the plot, the following processing steps were performed:
Original data file (external link)
To produce the plot, the following processing steps were performed:
Original data file (external link)
Citations: Huang, B., M. J. Menne, T. Boyer, E. Freeman, B. E. Gleason, J. H. Lawrimore, C. Liu, J. J. Rennie, C. Schreck, F. Sun, R. Vose, C. N. Williams, X. Yin, H.-M. Zhang, 2020: Uncertainty estimates for sea surface temperature and land surface air temperature in NOAAGlobalTemp version 5. , J. Climate, 33, 1351-1379, DOI: 10.1175/JCLI-D-19-0395.1. Zhang, Huai-Min, Jay H. Lawrimore, Boyin Huang, Matthew J. Menne, Xungang Yin, Ahira Sȧnchez-Lugo, Byron E. Gleason, Russell Vose, Derek Arndt, J. Jared Rennie, and Claude N. Williams. (2019) Updated Temperature Data Give a Sharper View of Climate Trends. Eos, 100, https://doi.org/10.1029/2019EO128229.
Data citation: Zhang, H.-M., B. Huang, J. Lawrimore, M. Menne, Thomas M. Smith, NOAA Global Surface Temperature Dataset (NOAAGlobalTemp), Version 5 [indicate subset used]. NOAA National Centers for Environmental Information. doi:10.25921/9qth-2p70 Accessed [2023-02-02 09:18:32].
To produce the plot, the following processing steps were performed:
Global mean temperature is based on measurements made at weather stations over land and by ships and buoys over the ocean. Temperatures are typically expressed as anomalies which are temperature differences from the average for a standard period. Here, 1850-1900 is used for the global mean. Instrumental temperature records are some of the longest climate records available, with some series extending back to the 17th century.
The data in the above plot are available in a zip file containing a csv file for each data set.
Data file: Continental_trends_data_files.zip
Checksum: e87749f4508553e4b68008a0991c7c57
Format: BADC CSV format
Original data file (external link)
To produce the plot, the following processing steps were performed:
Original data file (external link)
To produce the plot, the following processing steps were performed:
Original data file (external link)
Data citation: GISTEMP Team, 2022: GISS Surface Temperature Analysis (GISTEMP), version 4. NASA Goddard Institute for Space Studies. Dataset accessed 2022-09-01 09:16:10 at data.giss.nasa.gov/gistemp/.
To produce the plot, the following processing steps were performed:
Original data file (external link) Original data file (external link)
Acknowledgement: HadCRUT.5.0.1.0 data were obtained from http://www.metoffice.gov.uk/hadobs/hadcrut5 on 2022-09-01 09:16:14 and are © British Crown Copyright, Met Office 2022, provided under an Open Government License, http://www.nationalarchives.gov.uk/doc/open-government-licence/version/3/
To produce the plot, the following processing steps were performed:
Original data file (external link)
To produce the plot, the following processing steps were performed:
Original data file (external link)
Citations: Huang, B., M. J. Menne, T. Boyer, E. Freeman, B. E. Gleason, J. H. Lawrimore, C. Liu, J. J. Rennie, C. Schreck, F. Sun, R. Vose, C. N. Williams, X. Yin, H.-M. Zhang, 2020: Uncertainty estimates for sea surface temperature and land surface air temperature in NOAAGlobalTemp version 5. , J. Climate, 33, 1351-1379, DOI: 10.1175/JCLI-D-19-0395.1. Zhang, Huai-Min, Jay H. Lawrimore, Boyin Huang, Matthew J. Menne, Xungang Yin, Ahira Sȧnchez-Lugo, Byron E. Gleason, Russell Vose, Derek Arndt, J. Jared Rennie, and Claude N. Williams. (2019) Updated Temperature Data Give a Sharper View of Climate Trends. Eos, 100, https://doi.org/10.1029/2019EO128229.
Data citation: Zhang, H.-M., B. Huang, J. Lawrimore, M. Menne, Thomas M. Smith, NOAA Global Surface Temperature Dataset (NOAAGlobalTemp), Version 5 [indicate subset used]. NOAA National Centers for Environmental Information. doi:10.25921/9qth-2p70 Accessed [2022-09-01 09:16:36].
To produce the plot, the following processing steps were performed:
Original data file (external link)
To produce the plot, the following processing steps were performed:
Original data file (external link)
To produce the plot, the following processing steps were performed:
Original data file (external link)
Data citation: GISTEMP Team, 2022: GISS Surface Temperature Analysis (GISTEMP), version 4. NASA Goddard Institute for Space Studies. Dataset accessed 2023-02-02 09:18:24 at data.giss.nasa.gov/gistemp/.
To produce the plot, the following processing steps were performed:
Original data file (external link)
Acknowledgement: HadCRUT.5.0.1.0 data were obtained from http://www.metoffice.gov.uk/hadobs/hadcrut5 on 2023-02-02 09:18:25 and are © British Crown Copyright, Met Office 2023, provided under an Open Government License, http://www.nationalarchives.gov.uk/doc/open-government-licence/version/3/
To produce the plot, the following processing steps were performed:
Original data file (external link)
To produce the plot, the following processing steps were performed:
Original data file (external link)
Citations: Huang, B., M. J. Menne, T. Boyer, E. Freeman, B. E. Gleason, J. H. Lawrimore, C. Liu, J. J. Rennie, C. Schreck, F. Sun, R. Vose, C. N. Williams, X. Yin, H.-M. Zhang, 2020: Uncertainty estimates for sea surface temperature and land surface air temperature in NOAAGlobalTemp version 5. , J. Climate, 33, 1351-1379, DOI: 10.1175/JCLI-D-19-0395.1. Zhang, Huai-Min, Jay H. Lawrimore, Boyin Huang, Matthew J. Menne, Xungang Yin, Ahira Sȧnchez-Lugo, Byron E. Gleason, Russell Vose, Derek Arndt, J. Jared Rennie, and Claude N. Williams. (2019) Updated Temperature Data Give a Sharper View of Climate Trends. Eos, 100, https://doi.org/10.1029/2019EO128229.
Data citation: Zhang, H.-M., B. Huang, J. Lawrimore, M. Menne, Thomas M. Smith, NOAA Global Surface Temperature Dataset (NOAAGlobalTemp), Version 5 [indicate subset used]. NOAA National Centers for Environmental Information. doi:10.25921/9qth-2p70 Accessed [2023-02-02 09:18:32].
To produce the plot, the following processing steps were performed:
Original data file (external link)
To produce the plot, the following processing steps were performed:
Original data file (external link)
To produce the plot, the following processing steps were performed:
Original data file (external link)
Data citation: GISTEMP Team, 2022: GISS Surface Temperature Analysis (GISTEMP), version 4. NASA Goddard Institute for Space Studies. Dataset accessed 2023-02-02 09:18:24 at data.giss.nasa.gov/gistemp/.
To produce the plot, the following processing steps were performed:
Original data file (external link)
Acknowledgement: HadCRUT.5.0.1.0 data were obtained from http://www.metoffice.gov.uk/hadobs/hadcrut5 on 2023-02-02 09:18:25 and are © British Crown Copyright, Met Office 2023, provided under an Open Government License, http://www.nationalarchives.gov.uk/doc/open-government-licence/version/3/
To produce the plot, the following processing steps were performed:
Original data file (external link)
To produce the plot, the following processing steps were performed:
Original data file (external link)
Citations: Huang, B., M. J. Menne, T. Boyer, E. Freeman, B. E. Gleason, J. H. Lawrimore, C. Liu, J. J. Rennie, C. Schreck, F. Sun, R. Vose, C. N. Williams, X. Yin, H.-M. Zhang, 2020: Uncertainty estimates for sea surface temperature and land surface air temperature in NOAAGlobalTemp version 5. , J. Climate, 33, 1351-1379, DOI: 10.1175/JCLI-D-19-0395.1. Zhang, Huai-Min, Jay H. Lawrimore, Boyin Huang, Matthew J. Menne, Xungang Yin, Ahira Sȧnchez-Lugo, Byron E. Gleason, Russell Vose, Derek Arndt, J. Jared Rennie, and Claude N. Williams. (2019) Updated Temperature Data Give a Sharper View of Climate Trends. Eos, 100, https://doi.org/10.1029/2019EO128229.
Data citation: Zhang, H.-M., B. Huang, J. Lawrimore, M. Menne, Thomas M. Smith, NOAA Global Surface Temperature Dataset (NOAAGlobalTemp), Version 5 [indicate subset used]. NOAA National Centers for Environmental Information. doi:10.25921/9qth-2p70 Accessed [2023-02-02 09:18:32].
To produce the plot, the following processing steps were performed:
The data in the above plot are available in a zip file containing a csv file for each data set.
Data file: Regional_trends_Africa_data_files.zip
Checksum: 2fe1dce26f3634bd90d8e6286874d5d7
Format: BADC CSV format
Original data file (external link)
To produce the plot, the following processing steps were performed:
Original data file (external link)
To produce the plot, the following processing steps were performed:
Original data file (external link)
Data citation: GISTEMP Team, 2022: GISS Surface Temperature Analysis (GISTEMP), version 4. NASA Goddard Institute for Space Studies. Dataset accessed 2023-02-02 09:18:24 at data.giss.nasa.gov/gistemp/.
To produce the plot, the following processing steps were performed:
Original data file (external link)
Acknowledgement: HadCRUT.5.0.1.0 data were obtained from http://www.metoffice.gov.uk/hadobs/hadcrut5 on 2023-02-02 09:18:25 and are © British Crown Copyright, Met Office 2023, provided under an Open Government License, http://www.nationalarchives.gov.uk/doc/open-government-licence/version/3/
To produce the plot, the following processing steps were performed:
Original data file (external link)
To produce the plot, the following processing steps were performed:
Original data file (external link)
Citations: Huang, B., M. J. Menne, T. Boyer, E. Freeman, B. E. Gleason, J. H. Lawrimore, C. Liu, J. J. Rennie, C. Schreck, F. Sun, R. Vose, C. N. Williams, X. Yin, H.-M. Zhang, 2020: Uncertainty estimates for sea surface temperature and land surface air temperature in NOAAGlobalTemp version 5. , J. Climate, 33, 1351-1379, DOI: 10.1175/JCLI-D-19-0395.1. Zhang, Huai-Min, Jay H. Lawrimore, Boyin Huang, Matthew J. Menne, Xungang Yin, Ahira Sȧnchez-Lugo, Byron E. Gleason, Russell Vose, Derek Arndt, J. Jared Rennie, and Claude N. Williams. (2019) Updated Temperature Data Give a Sharper View of Climate Trends. Eos, 100, https://doi.org/10.1029/2019EO128229.
Data citation: Zhang, H.-M., B. Huang, J. Lawrimore, M. Menne, Thomas M. Smith, NOAA Global Surface Temperature Dataset (NOAAGlobalTemp), Version 5 [indicate subset used]. NOAA National Centers for Environmental Information. doi:10.25921/9qth-2p70 Accessed [2023-02-02 09:18:32].
To produce the plot, the following processing steps were performed:
Original data file (external link)
To produce the plot, the following processing steps were performed:
Original data file (external link)
To produce the plot, the following processing steps were performed:
Original data file (external link)
Data citation: GISTEMP Team, 2022: GISS Surface Temperature Analysis (GISTEMP), version 4. NASA Goddard Institute for Space Studies. Dataset accessed 2023-02-02 09:18:24 at data.giss.nasa.gov/gistemp/.
To produce the plot, the following processing steps were performed:
Original data file (external link)
Acknowledgement: HadCRUT.5.0.1.0 data were obtained from http://www.metoffice.gov.uk/hadobs/hadcrut5 on 2023-02-02 09:18:25 and are © British Crown Copyright, Met Office 2023, provided under an Open Government License, http://www.nationalarchives.gov.uk/doc/open-government-licence/version/3/
To produce the plot, the following processing steps were performed:
Original data file (external link)
To produce the plot, the following processing steps were performed:
Original data file (external link)
Citations: Huang, B., M. J. Menne, T. Boyer, E. Freeman, B. E. Gleason, J. H. Lawrimore, C. Liu, J. J. Rennie, C. Schreck, F. Sun, R. Vose, C. N. Williams, X. Yin, H.-M. Zhang, 2020: Uncertainty estimates for sea surface temperature and land surface air temperature in NOAAGlobalTemp version 5. , J. Climate, 33, 1351-1379, DOI: 10.1175/JCLI-D-19-0395.1. Zhang, Huai-Min, Jay H. Lawrimore, Boyin Huang, Matthew J. Menne, Xungang Yin, Ahira Sȧnchez-Lugo, Byron E. Gleason, Russell Vose, Derek Arndt, J. Jared Rennie, and Claude N. Williams. (2019) Updated Temperature Data Give a Sharper View of Climate Trends. Eos, 100, https://doi.org/10.1029/2019EO128229.
Data citation: Zhang, H.-M., B. Huang, J. Lawrimore, M. Menne, Thomas M. Smith, NOAA Global Surface Temperature Dataset (NOAAGlobalTemp), Version 5 [indicate subset used]. NOAA National Centers for Environmental Information. doi:10.25921/9qth-2p70 Accessed [2023-02-02 09:18:32].
To produce the plot, the following processing steps were performed:
Page created on 2023-02-03 using climind v0.1
