WMO Climate Monitoring Dashboards

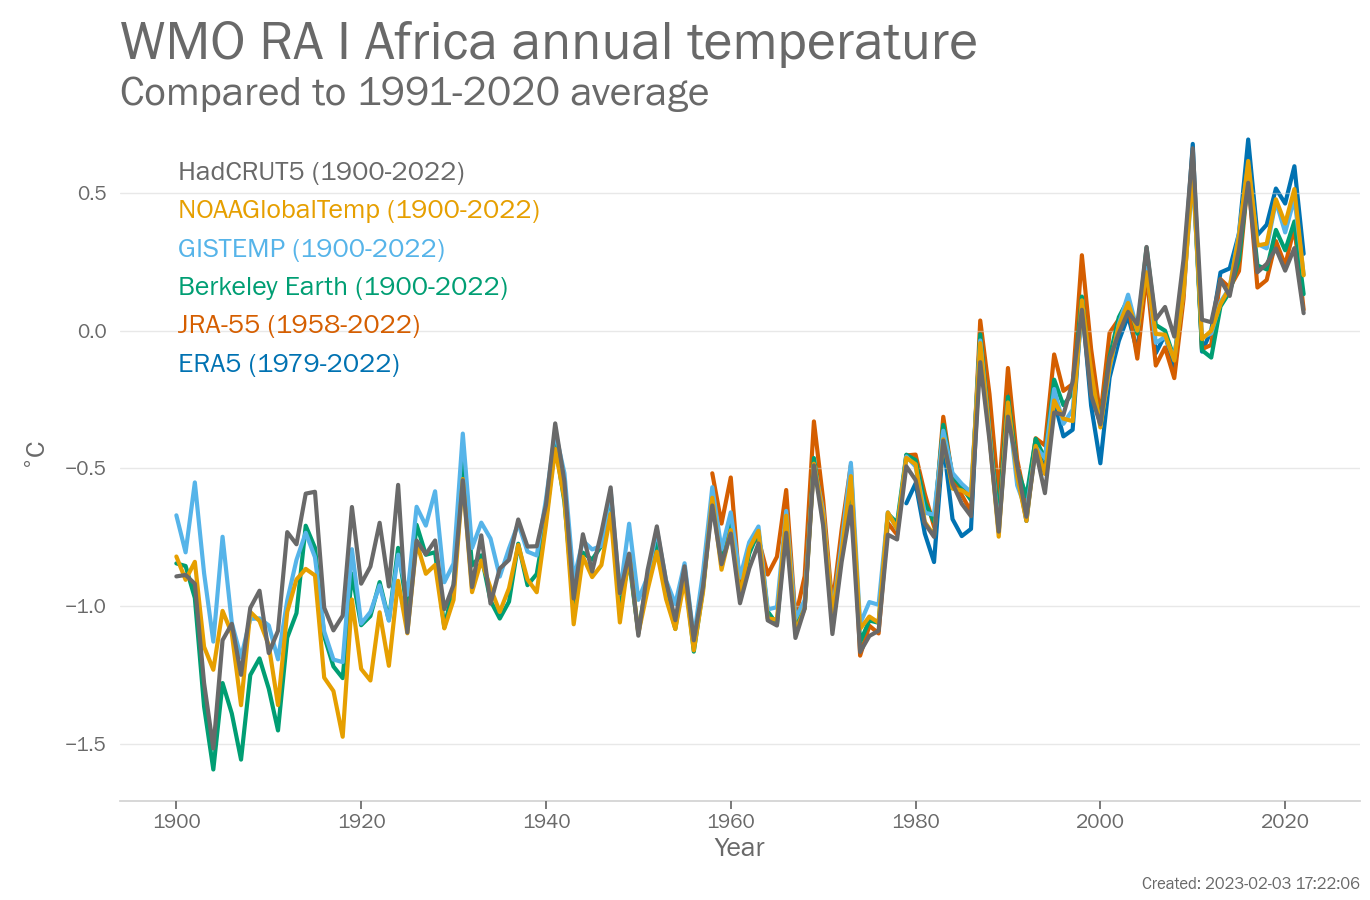
Annual Regional mean temperature for WMO RA 1 Africa (°C, difference from the 1991-2020 average)  from 1900-2022. Data are from the following six data sets: Berkeley Earth, ERA5, GISTEMP, HadCRUT5, JRA-55, NOAAGlobalTemp.

WMO RA I Africa

Image: png-pdf-svg
Formatted data: csv (format)
References and processing
Click for more indicators

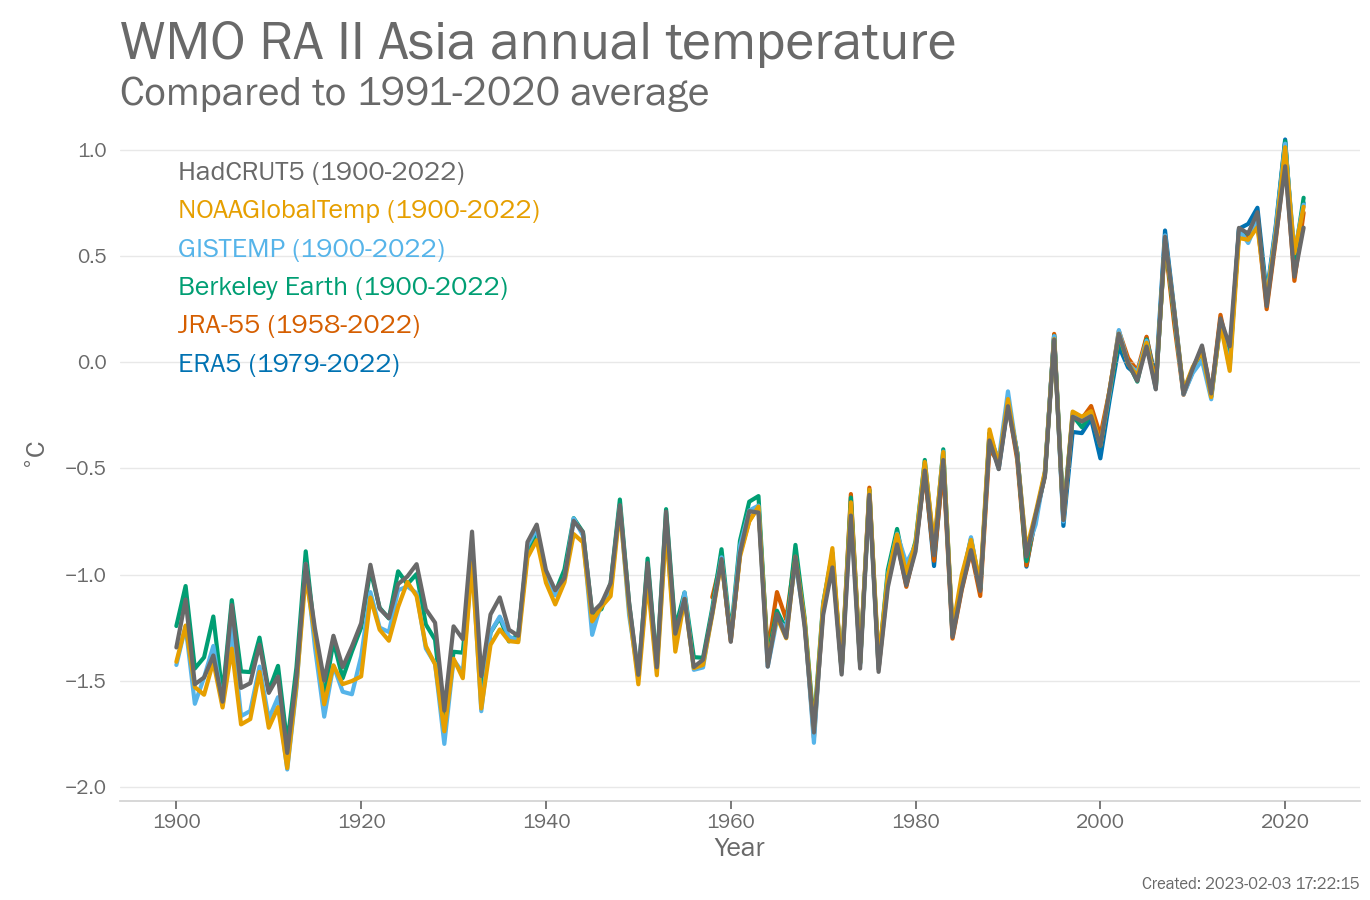
Annual Regional mean temperature for WMO RA 2 Asia (°C, difference from the 1991-2020 average)  from 1900-2022. Data are from the following six data sets: Berkeley Earth, ERA5, GISTEMP, HadCRUT5, JRA-55, NOAAGlobalTemp.

WMO RA II Asia

Image: png-pdf-svg
Formatted data: csv (format)
References and processing
Click for more indicators

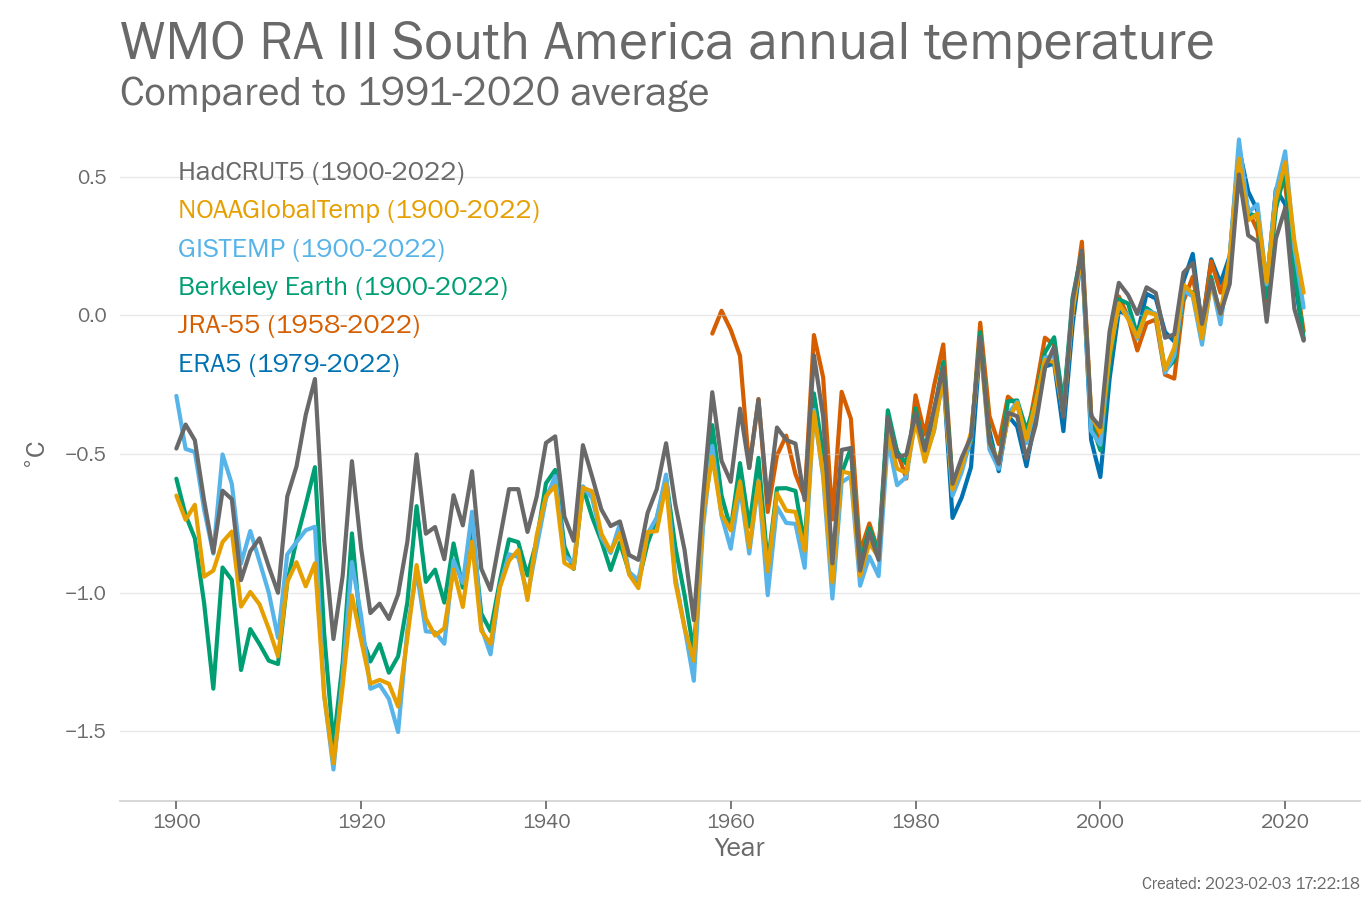
Annual Regional mean temperature for WMO RA 3 South America (°C, difference from the 1991-2020 average)  from 1900-2022. Data are from the following six data sets: Berkeley Earth, ERA5, GISTEMP, HadCRUT5, JRA-55, NOAAGlobalTemp.

WMO RA III South America

Image: png-pdf-svg
Formatted data: csv (format)
References and processing
Click for more indicators

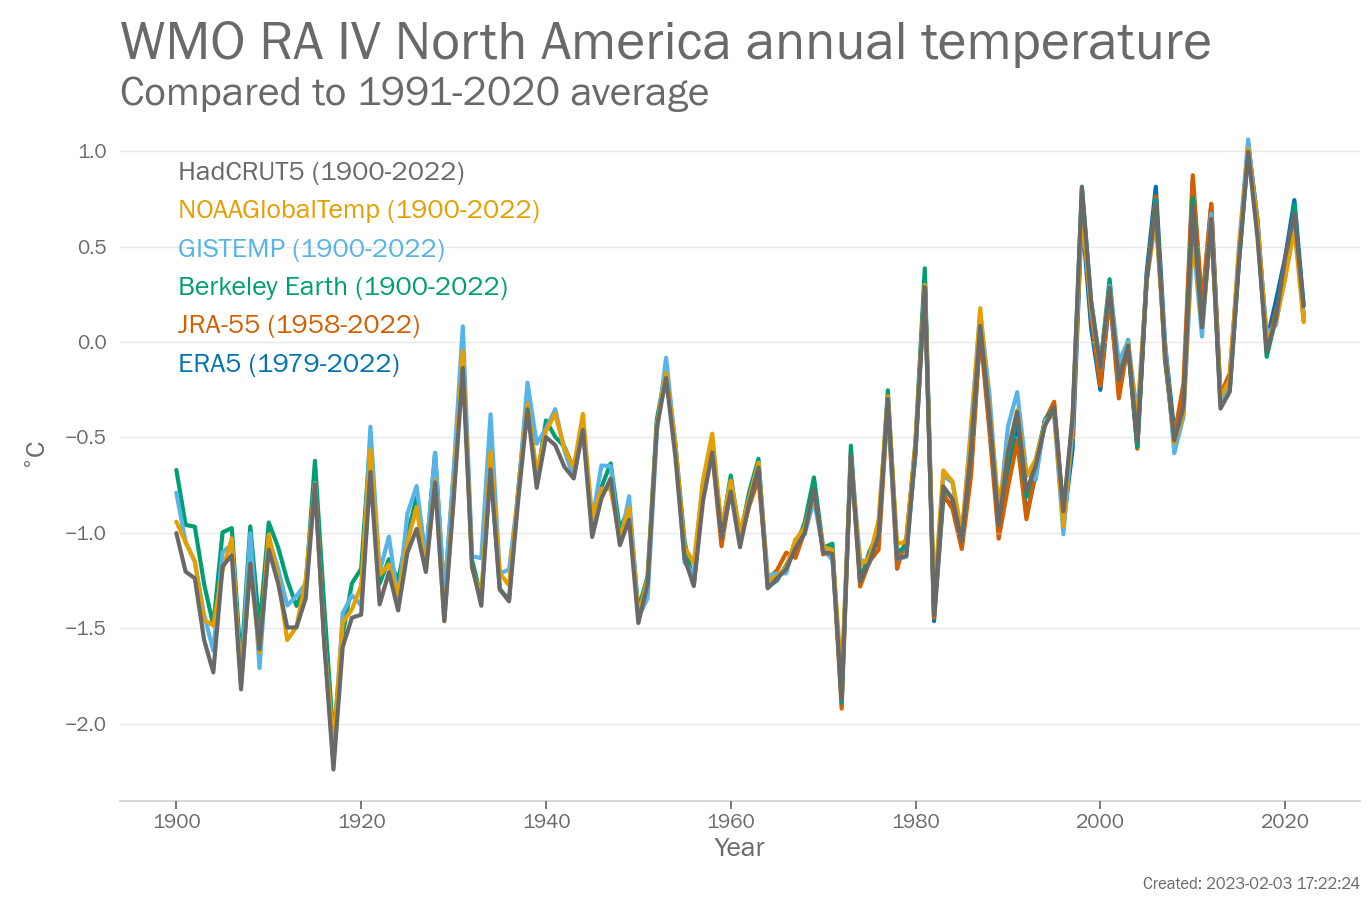
Annual Regional mean temperature for WMO RA 4 North America (°C, difference from the 1991-2020 average)  from 1900-2022. Data are from the following six data sets: Berkeley Earth, ERA5, GISTEMP, HadCRUT5, JRA-55, NOAAGlobalTemp.

WMO RA IV North America

Image: png-pdf-svg
Formatted data: csv (format)
References and processing
Click for more indicators

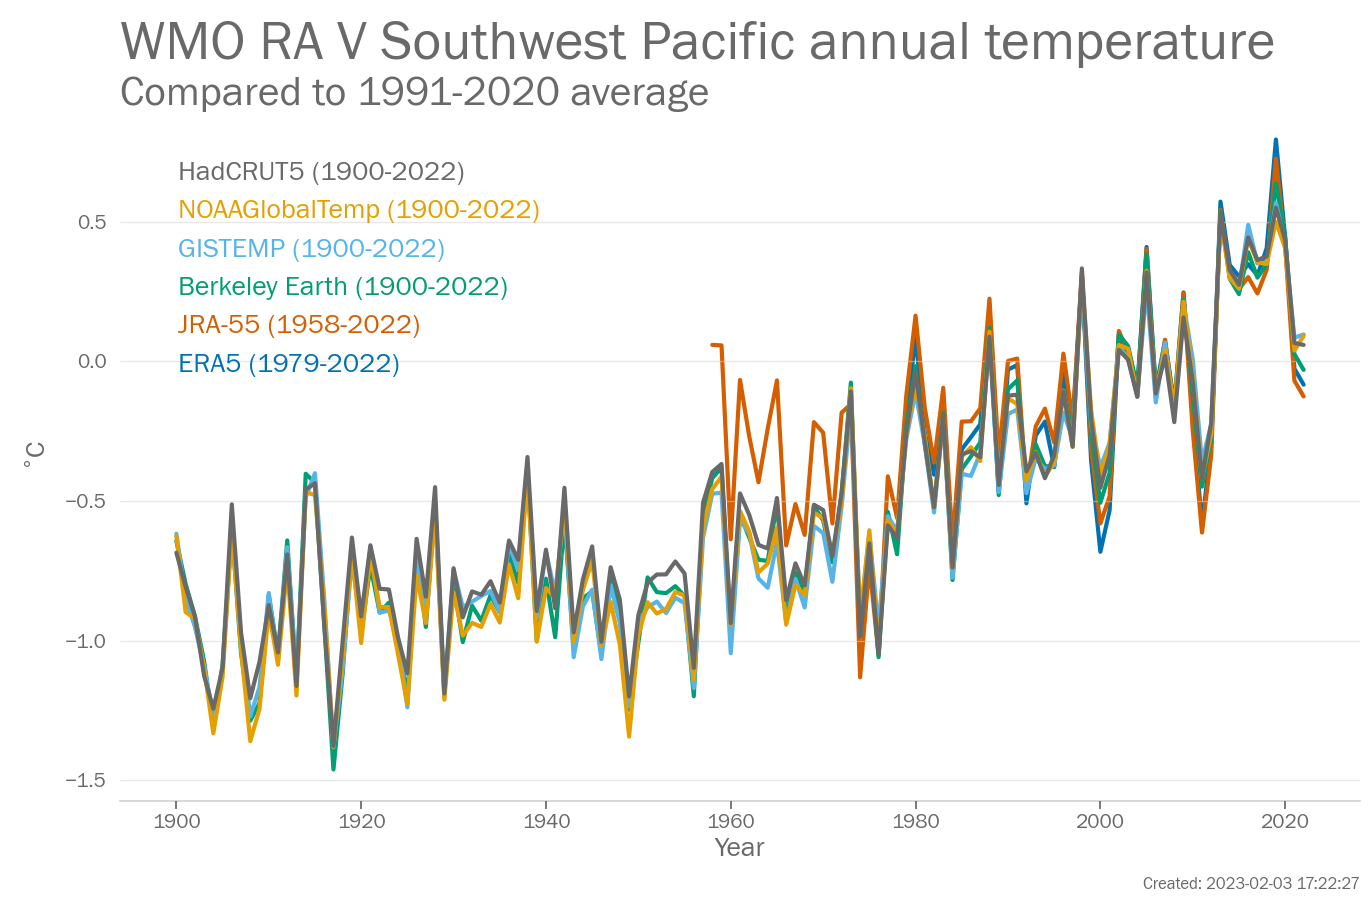
Annual Regional mean temperature for WMO RA 5 South-West Pacific (°C, difference from the 1991-2020 average)  from 1900-2022. Data are from the following six data sets: Berkeley Earth, ERA5, GISTEMP, HadCRUT5, JRA-55, NOAAGlobalTemp.

WMO RA V Southwest Pacific

Image: png-pdf-svg
Formatted data: csv (format)
References and processing
Click for more indicators

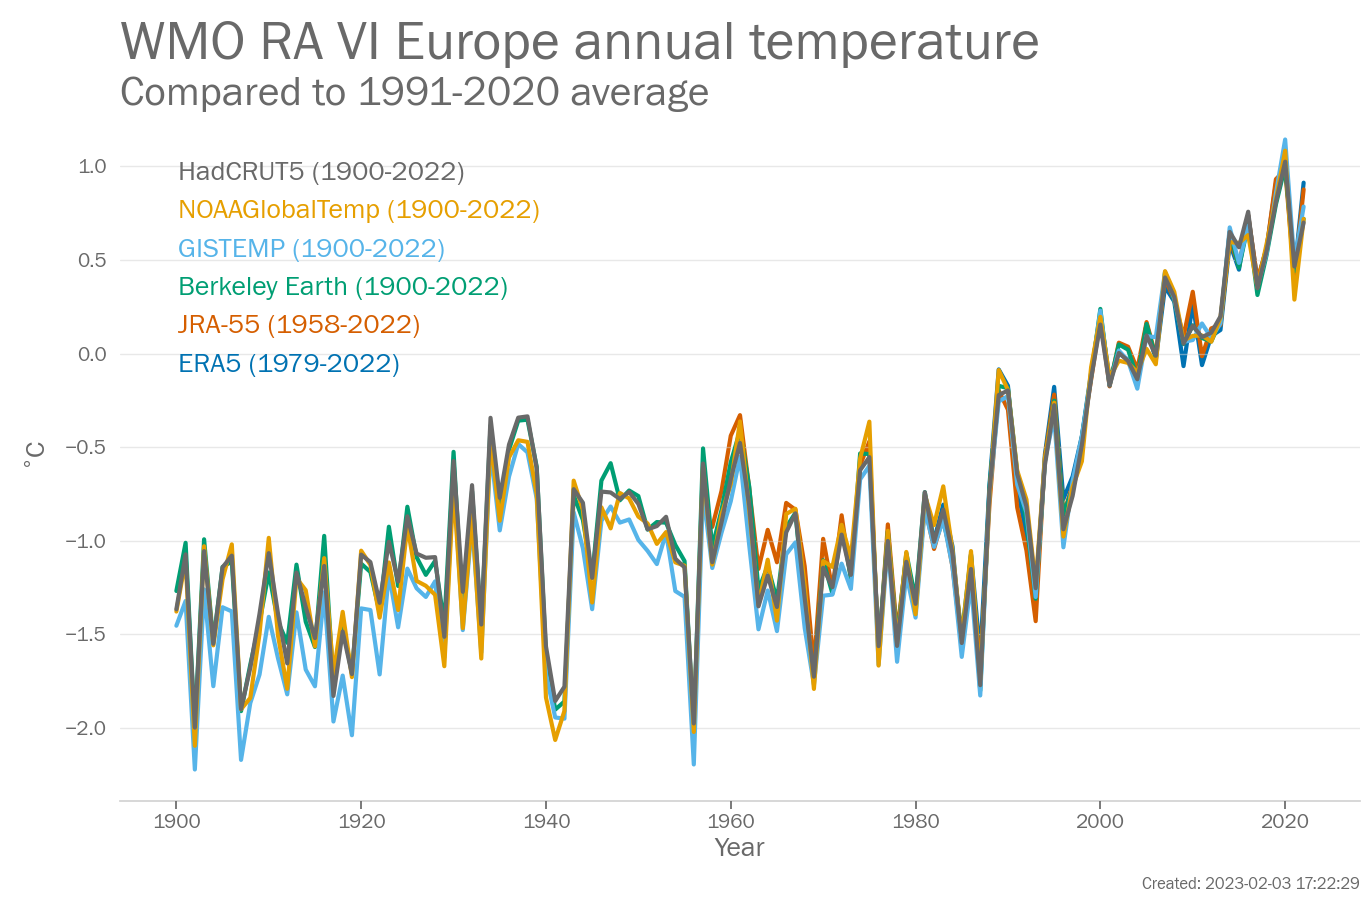
Annual Regional mean temperature for WMO RA 6 Europe (°C, difference from the 1991-2020 average)  from 1900-2022. Data are from the following six data sets: Berkeley Earth, ERA5, GISTEMP, HadCRUT5, JRA-55, NOAAGlobalTemp.

WMO RA VI Europe

Image: png-pdf-svg
Formatted data: csv (format)
References and processing
Click for more indicators

Regional mean temperature for WMO RA 1 Africa

The year 2022 was ranked between the 9th and 16th highest on record. The mean value for 2022 was 0.16°C relative to the 1991-2020 average (0.06-0.28°C depending on the data set used). 6 data sets were used in this assessment: Berkeley Earth, ERA5, GISTEMP, HadCRUT5, JRA-55, and NOAAGlobalTemp. Relative to a 1961-1990 baseline, the mean value for 2022 was 0.84°C (0.74-0.91°C depending on the data set used). 5 data sets were used in the assessment relative to 1961-1990.

Regional mean temperature for WMO RA 2 Asia

The year 2022 was ranked between the 2nd and 3rd highest on record. The mean value for 2022 was 0.72°C relative to the 1991-2020 average (0.63-0.77°C depending on the data set used). 6 data sets were used in this assessment: Berkeley Earth, ERA5, GISTEMP, HadCRUT5, JRA-55, and NOAAGlobalTemp. Relative to a 1961-1990 baseline, the mean value for 2022 was 1.67°C (1.60-1.70°C depending on the data set used). 5 data sets were used in the assessment relative to 1961-1990.

Regional mean temperature for WMO RA 3 South America

The year 2022 was ranked between the 12th and 25th highest on record. The mean value for 2022 was -0.04°C relative to the 1991-2020 average (-0.09-0.08°C depending on the data set used). 6 data sets were used in this assessment: Berkeley Earth, ERA5, GISTEMP, HadCRUT5, JRA-55, and NOAAGlobalTemp. Relative to a 1961-1990 baseline, the mean value for 2022 was 0.51°C (0.39-0.67°C depending on the data set used). 5 data sets were used in the assessment relative to 1961-1990.

Regional mean temperature for WMO RA 4 North America

The year 2022 was ranked between the 14th and 16th highest on record. The mean value for 2022 was 0.14°C relative to the 1991-2020 average (0.10-0.19°C depending on the data set used). 6 data sets were used in this assessment: Berkeley Earth, ERA5, GISTEMP, HadCRUT5, JRA-55, and NOAAGlobalTemp. Relative to a 1961-1990 baseline, the mean value for 2022 was 1.00°C (0.94-1.07°C depending on the data set used). 5 data sets were used in the assessment relative to 1961-1990.

Regional mean temperature for WMO RA 5 South-West Pacific

The year 2022 was ranked between the 12th and 28th highest on record. The mean value for 2022 was 0.00°C relative to the 1991-2020 average (-0.13-0.10°C depending on the data set used). 6 data sets were used in this assessment: Berkeley Earth, ERA5, GISTEMP, HadCRUT5, JRA-55, and NOAAGlobalTemp. Relative to a 1961-1990 baseline, the mean value for 2022 was 0.50°C (0.21-0.64°C depending on the data set used). 5 data sets were used in the assessment relative to 1961-1990.

Regional mean temperature for WMO RA 6 Europe

The year 2022 was ranked between the 2nd and 4th highest on record. The mean value for 2022 was 0.79°C relative to the 1991-2020 average (0.70-0.91°C depending on the data set used). 6 data sets were used in this assessment: Berkeley Earth, ERA5, GISTEMP, HadCRUT5, JRA-55, and NOAAGlobalTemp. Relative to a 1961-1990 baseline, the mean value for 2022 was 1.81°C (1.73-1.92°C depending on the data set used). 5 data sets were used in the assessment relative to 1961-1990.

WMO RA I Africa

The data in the above plot are available in a zip file containing a csv file for each data set.

Data file: WMO_RA_I_Africa_data_files.zip
Checksum: 18e310c01392561bece64b6b6a152f97
Format: BADC CSV format

Berkeley Earth

Original data file (external link)

Citation: Rohde, R. A. and Hausfather, Z.: The Berkeley Earth Land/Ocean Temperature Record, Earth Syst. Sci. Data, 12, 3469-3479, https://doi.org/10.5194/essd-12-3469-2020, 2020.

To produce the plot, the following processing steps were performed:

  • "Data set created from file ['Land_and_Ocean_LatLong1.nc'] downloaded from ['http://berkeleyearth.lbl.gov/auto/Global/Gridded/Land_and_Ocean_LatLong1.nc'] at ['2023-02-02 09:17:44']"
  • "Rebaselined to 1991-2020"
  • "Calculated area-average"
  • "Calculated annual average from monthly averages using arithmetic mean"
  • "Selected years within the range 1900 to 2022."
  • "Wrote to file wmo_ra_1_Berkeley Earth.csv"
  • Data set created from file ['wmo_ra_1_Berkeley Earth.csv'] downloaded from [''] at ['2023-02-02 18:38:27']

ERA5

Original data file (external link)

Citation: Hersbach H, Bell B, Berrisford P et al. 2020. The ERA5 global reanalysis. Q. J. R. Meteorol. Soc. 146: 1999-2049. https://doi.org/10.1002/qj.3803.

To produce the plot, the following processing steps were performed:

  • "Gridded dataset created from file ['era5_2m_tas_2023.nc'] downloaded from ['']"
  • "Regridded to 1 degree latitude-longitude resolution"
  • "Rebaselined to 1991-2020"
  • "Calculated area-average"
  • "Calculated annual average from monthly averages using arithmetic mean"
  • "Selected years within the range 1900 to 2022."
  • "Wrote to file wmo_ra_1_ERA5.csv"
  • Data set created from file ['wmo_ra_1_ERA5.csv'] downloaded from [''] at ['2023-02-02 18:39:04']

GISTEMP

Original data file (external link)

Citation: Lenssen, N., G. Schmidt, J. Hansen, M. Menne, A. Persin, R. Ruedy, and D. Zyss, 2019: Improvements in the GISTEMP uncertainty model. J. Geophys. Res. Atmos., 124, no. 12, 6307-6326, doi:10.1029/2018JD029522.

Data citation: GISTEMP Team, 2022: GISS Surface Temperature Analysis (GISTEMP), version 4. NASA Goddard Institute for Space Studies. Dataset accessed 2023-02-02 09:18:24 at data.giss.nasa.gov/gistemp/.

To produce the plot, the following processing steps were performed:

  • "Data set created from file ['gistemp1200_GHCNv4_ERSSTv5.nc.gz'] downloaded from ['https://data.giss.nasa.gov/pub/gistemp/gistemp1200_GHCNv4_ERSSTv5.nc.gz'] at ['2023-02-02 09:18:24']"
  • "Regridded to 1 degree latitude-longitude resolution"
  • "Rebaselined to 1991-2020"
  • "Calculated area-average"
  • "Calculated annual average from monthly averages using arithmetic mean"
  • "Selected years within the range 1900 to 2022."
  • "Wrote to file wmo_ra_1_GISTEMP.csv"
  • Data set created from file ['wmo_ra_1_GISTEMP.csv'] downloaded from [''] at ['2023-02-02 18:39:17']

HadCRUT5

Original data file (external link)

Citation: Morice, C. P., Kennedy, J. J., Rayner, N. A., Winn, J. P., Hogan, E., Killick, R. E., et al. (2021). An updated assessment of near-surface temperature change from 1850: the HadCRUT5 data set. Journal of Geophysical Research: Atmospheres, 126, e2019JD032361. https://doi.org/10.1029/2019JD032361.

Acknowledgement: HadCRUT.5.0.1.0 data were obtained from http://www.metoffice.gov.uk/hadobs/hadcrut5 on 2023-02-02 09:18:25 and are © British Crown Copyright, Met Office 2023, provided under an Open Government License, http://www.nationalarchives.gov.uk/doc/open-government-licence/version/3/

To produce the plot, the following processing steps were performed:

  • "Data set created from file ['HadCRUT.5.0.1.0.analysis.anomalies.ensemble_mean.nc'] downloaded from ['https://www.metoffice.gov.uk/hadobs/hadcrut5/data/current/analysis/HadCRUT.5.0.1.0.analysis.anomalies.ensemble_mean.nc'] at ['2023-02-02 09:18:25']"
  • "Regridded to 1 degree latitude-longitude resolution"
  • "Rebaselined to 1991-2020"
  • "Calculated area-average"
  • "Calculated annual average from monthly averages using arithmetic mean"
  • "Selected years within the range 1900 to 2022."
  • "Wrote to file wmo_ra_1_HadCRUT5.csv"
  • Data set created from file ['wmo_ra_1_HadCRUT5.csv'] downloaded from [''] at ['2023-02-02 18:39:45']

JRA-55

Original data file (external link)

Citation: Kobayashi, S., Ota, Y., Harada, Y., Ebita, A., Moriya, M., Onoda, H., Onogi, K., Kamahori, H., Kobayashi, C., Endo, H. and Miyaoka, K., (2015). The JRA-55 reanalysis: General specifications and basic characteristics. Journal of the Meteorological Society of Japan. Ser. II, 93(1), pp.5-48..

To produce the plot, the following processing steps were performed:

  • "Data set created from file ['anl_surf125.011_tmp.202301_202312', 'anl_surf125.2023MMMM'] downloaded from ['', ''] at ['2023-01-09 09:22:14']"
  • "Regridded to 1 degree latitude-longitude resolution"
  • "Rebaselined to 1991-2020"
  • "Calculated area-average"
  • "Calculated annual average from monthly averages using arithmetic mean"
  • "Selected years within the range 1900 to 2022."
  • "Wrote to file wmo_ra_1_JRA-55.csv"
  • Data set created from file ['wmo_ra_1_JRA-55.csv'] downloaded from [''] at ['2023-02-02 18:40:21']

NOAAGlobalTemp

Original data file (external link)

Citations: Huang, B., M. J. Menne, T. Boyer, E. Freeman, B. E. Gleason, J. H. Lawrimore, C. Liu, J. J. Rennie, C. Schreck, F. Sun, R. Vose, C. N. Williams, X. Yin, H.-M. Zhang, 2020: Uncertainty estimates for sea surface temperature and land surface air temperature in NOAAGlobalTemp version 5. , J. Climate, 33, 1351-1379, DOI: 10.1175/JCLI-D-19-0395.1. Zhang, Huai-Min, Jay H. Lawrimore, Boyin Huang, Matthew J. Menne, Xungang Yin, Ahira Sȧnchez-Lugo, Byron E. Gleason, Russell Vose, Derek Arndt, J. Jared Rennie, and Claude N. Williams. (2019) Updated Temperature Data Give a Sharper View of Climate Trends. Eos, 100, https://doi.org/10.1029/2019EO128229.

Data citation: Zhang, H.-M., B. Huang, J. Lawrimore, M. Menne, Thomas M. Smith, NOAA Global Surface Temperature Dataset (NOAAGlobalTemp), Version 5 [indicate subset used]. NOAA National Centers for Environmental Information. doi:10.25921/9qth-2p70 Accessed [2023-02-02 09:18:32].

To produce the plot, the following processing steps were performed:

  • "Data set created from file ['NOAAGlobalTemp_v*.nc'] downloaded from ['https://www.ncei.noaa.gov/data/noaa-global-surface-temperature/v5/access/gridded/NOAAGlobalTemp_v.*.nc'] at ['2023-02-02 09:18:32']"
  • "Data set created from file ['NOAAGlobalTemp_v*.nc'] downloaded from ['https://www.ncei.noaa.gov/data/noaa-global-surface-temperature/v5/access/gridded/NOAAGlobalTemp_v.*.nc'] at ['2023-02-02 09:18:32']"
  • "Regridded to 1 degree latitude-longitude resolution"
  • "Rebaselined to 1991-2020"
  • "Calculated area-average"
  • "Calculated annual average from monthly averages using arithmetic mean"
  • "Selected years within the range 1900 to 2022."
  • "Wrote to file wmo_ra_1_NOAAGlobalTemp.csv"
  • Data set created from file ['wmo_ra_1_NOAAGlobalTemp.csv'] downloaded from [''] at ['2023-02-02 18:40:39']

WMO RA II Asia

The data in the above plot are available in a zip file containing a csv file for each data set.

Data file: WMO_RA_II_Asia_data_files.zip
Checksum: 52169447f6c21c8b403d8d77ee194c42
Format: BADC CSV format

Berkeley Earth

Original data file (external link)

Citation: Rohde, R. A. and Hausfather, Z.: The Berkeley Earth Land/Ocean Temperature Record, Earth Syst. Sci. Data, 12, 3469-3479, https://doi.org/10.5194/essd-12-3469-2020, 2020.

To produce the plot, the following processing steps were performed:

  • "Data set created from file ['Land_and_Ocean_LatLong1.nc'] downloaded from ['http://berkeleyearth.lbl.gov/auto/Global/Gridded/Land_and_Ocean_LatLong1.nc'] at ['2023-02-02 09:17:44']"
  • "Rebaselined to 1991-2020"
  • "Calculated area-average"
  • "Calculated annual average from monthly averages using arithmetic mean"
  • "Selected years within the range 1900 to 2022."
  • "Wrote to file wmo_ra_2_Berkeley Earth.csv"
  • Data set created from file ['wmo_ra_2_Berkeley Earth.csv'] downloaded from [''] at ['2023-02-02 18:38:29']

ERA5

Original data file (external link)

Citation: Hersbach H, Bell B, Berrisford P et al. 2020. The ERA5 global reanalysis. Q. J. R. Meteorol. Soc. 146: 1999-2049. https://doi.org/10.1002/qj.3803.

To produce the plot, the following processing steps were performed:

  • "Gridded dataset created from file ['era5_2m_tas_2023.nc'] downloaded from ['']"
  • "Regridded to 1 degree latitude-longitude resolution"
  • "Rebaselined to 1991-2020"
  • "Calculated area-average"
  • "Calculated annual average from monthly averages using arithmetic mean"
  • "Selected years within the range 1900 to 2022."
  • "Wrote to file wmo_ra_2_ERA5.csv"
  • Data set created from file ['wmo_ra_2_ERA5.csv'] downloaded from [''] at ['2023-02-02 18:39:05']

GISTEMP

Original data file (external link)

Citation: Lenssen, N., G. Schmidt, J. Hansen, M. Menne, A. Persin, R. Ruedy, and D. Zyss, 2019: Improvements in the GISTEMP uncertainty model. J. Geophys. Res. Atmos., 124, no. 12, 6307-6326, doi:10.1029/2018JD029522.

Data citation: GISTEMP Team, 2022: GISS Surface Temperature Analysis (GISTEMP), version 4. NASA Goddard Institute for Space Studies. Dataset accessed 2023-02-02 09:18:24 at data.giss.nasa.gov/gistemp/.

To produce the plot, the following processing steps were performed:

  • "Data set created from file ['gistemp1200_GHCNv4_ERSSTv5.nc.gz'] downloaded from ['https://data.giss.nasa.gov/pub/gistemp/gistemp1200_GHCNv4_ERSSTv5.nc.gz'] at ['2023-02-02 09:18:24']"
  • "Regridded to 1 degree latitude-longitude resolution"
  • "Rebaselined to 1991-2020"
  • "Calculated area-average"
  • "Calculated annual average from monthly averages using arithmetic mean"
  • "Selected years within the range 1900 to 2022."
  • "Wrote to file wmo_ra_2_GISTEMP.csv"
  • Data set created from file ['wmo_ra_2_GISTEMP.csv'] downloaded from [''] at ['2023-02-02 18:39:18']

HadCRUT5

Original data file (external link)

Citation: Morice, C. P., Kennedy, J. J., Rayner, N. A., Winn, J. P., Hogan, E., Killick, R. E., et al. (2021). An updated assessment of near-surface temperature change from 1850: the HadCRUT5 data set. Journal of Geophysical Research: Atmospheres, 126, e2019JD032361. https://doi.org/10.1029/2019JD032361.

Acknowledgement: HadCRUT.5.0.1.0 data were obtained from http://www.metoffice.gov.uk/hadobs/hadcrut5 on 2023-02-02 09:18:25 and are © British Crown Copyright, Met Office 2023, provided under an Open Government License, http://www.nationalarchives.gov.uk/doc/open-government-licence/version/3/

To produce the plot, the following processing steps were performed:

  • "Data set created from file ['HadCRUT.5.0.1.0.analysis.anomalies.ensemble_mean.nc'] downloaded from ['https://www.metoffice.gov.uk/hadobs/hadcrut5/data/current/analysis/HadCRUT.5.0.1.0.analysis.anomalies.ensemble_mean.nc'] at ['2023-02-02 09:18:25']"
  • "Regridded to 1 degree latitude-longitude resolution"
  • "Rebaselined to 1991-2020"
  • "Calculated area-average"
  • "Calculated annual average from monthly averages using arithmetic mean"
  • "Selected years within the range 1900 to 2022."
  • "Wrote to file wmo_ra_2_HadCRUT5.csv"
  • Data set created from file ['wmo_ra_2_HadCRUT5.csv'] downloaded from [''] at ['2023-02-02 18:39:46']

JRA-55

Original data file (external link)

Citation: Kobayashi, S., Ota, Y., Harada, Y., Ebita, A., Moriya, M., Onoda, H., Onogi, K., Kamahori, H., Kobayashi, C., Endo, H. and Miyaoka, K., (2015). The JRA-55 reanalysis: General specifications and basic characteristics. Journal of the Meteorological Society of Japan. Ser. II, 93(1), pp.5-48..

To produce the plot, the following processing steps were performed:

  • "Data set created from file ['anl_surf125.011_tmp.202301_202312', 'anl_surf125.2023MMMM'] downloaded from ['', ''] at ['2023-01-09 09:22:14']"
  • "Regridded to 1 degree latitude-longitude resolution"
  • "Rebaselined to 1991-2020"
  • "Calculated area-average"
  • "Calculated annual average from monthly averages using arithmetic mean"
  • "Selected years within the range 1900 to 2022."
  • "Wrote to file wmo_ra_2_JRA-55.csv"
  • Data set created from file ['wmo_ra_2_JRA-55.csv'] downloaded from [''] at ['2023-02-02 18:40:22']

NOAAGlobalTemp

Original data file (external link)

Citations: Huang, B., M. J. Menne, T. Boyer, E. Freeman, B. E. Gleason, J. H. Lawrimore, C. Liu, J. J. Rennie, C. Schreck, F. Sun, R. Vose, C. N. Williams, X. Yin, H.-M. Zhang, 2020: Uncertainty estimates for sea surface temperature and land surface air temperature in NOAAGlobalTemp version 5. , J. Climate, 33, 1351-1379, DOI: 10.1175/JCLI-D-19-0395.1. Zhang, Huai-Min, Jay H. Lawrimore, Boyin Huang, Matthew J. Menne, Xungang Yin, Ahira Sȧnchez-Lugo, Byron E. Gleason, Russell Vose, Derek Arndt, J. Jared Rennie, and Claude N. Williams. (2019) Updated Temperature Data Give a Sharper View of Climate Trends. Eos, 100, https://doi.org/10.1029/2019EO128229.

Data citation: Zhang, H.-M., B. Huang, J. Lawrimore, M. Menne, Thomas M. Smith, NOAA Global Surface Temperature Dataset (NOAAGlobalTemp), Version 5 [indicate subset used]. NOAA National Centers for Environmental Information. doi:10.25921/9qth-2p70 Accessed [2023-02-02 09:18:32].

To produce the plot, the following processing steps were performed:

  • "Data set created from file ['NOAAGlobalTemp_v*.nc'] downloaded from ['https://www.ncei.noaa.gov/data/noaa-global-surface-temperature/v5/access/gridded/NOAAGlobalTemp_v.*.nc'] at ['2023-02-02 09:18:32']"
  • "Data set created from file ['NOAAGlobalTemp_v*.nc'] downloaded from ['https://www.ncei.noaa.gov/data/noaa-global-surface-temperature/v5/access/gridded/NOAAGlobalTemp_v.*.nc'] at ['2023-02-02 09:18:32']"
  • "Regridded to 1 degree latitude-longitude resolution"
  • "Rebaselined to 1991-2020"
  • "Calculated area-average"
  • "Calculated annual average from monthly averages using arithmetic mean"
  • "Selected years within the range 1900 to 2022."
  • "Wrote to file wmo_ra_2_NOAAGlobalTemp.csv"
  • Data set created from file ['wmo_ra_2_NOAAGlobalTemp.csv'] downloaded from [''] at ['2023-02-02 18:40:40']

WMO RA III South America

The data in the above plot are available in a zip file containing a csv file for each data set.

Data file: WMO_RA_III_South_America_data_files.zip
Checksum: d2bdc2b2c0aab8aa3c019830a6f1c3b4
Format: BADC CSV format

Berkeley Earth

Original data file (external link)

Citation: Rohde, R. A. and Hausfather, Z.: The Berkeley Earth Land/Ocean Temperature Record, Earth Syst. Sci. Data, 12, 3469-3479, https://doi.org/10.5194/essd-12-3469-2020, 2020.

To produce the plot, the following processing steps were performed:

  • "Data set created from file ['Land_and_Ocean_LatLong1.nc'] downloaded from ['http://berkeleyearth.lbl.gov/auto/Global/Gridded/Land_and_Ocean_LatLong1.nc'] at ['2023-02-02 09:17:44']"
  • "Rebaselined to 1991-2020"
  • "Calculated area-average"
  • "Calculated annual average from monthly averages using arithmetic mean"
  • "Selected years within the range 1900 to 2022."
  • "Wrote to file wmo_ra_3_Berkeley Earth.csv"
  • Data set created from file ['wmo_ra_3_Berkeley Earth.csv'] downloaded from [''] at ['2023-02-02 18:38:31']

ERA5

Original data file (external link)

Citation: Hersbach H, Bell B, Berrisford P et al. 2020. The ERA5 global reanalysis. Q. J. R. Meteorol. Soc. 146: 1999-2049. https://doi.org/10.1002/qj.3803.

To produce the plot, the following processing steps were performed:

  • "Gridded dataset created from file ['era5_2m_tas_2023.nc'] downloaded from ['']"
  • "Regridded to 1 degree latitude-longitude resolution"
  • "Rebaselined to 1991-2020"
  • "Calculated area-average"
  • "Calculated annual average from monthly averages using arithmetic mean"
  • "Selected years within the range 1900 to 2022."
  • "Wrote to file wmo_ra_3_ERA5.csv"
  • Data set created from file ['wmo_ra_3_ERA5.csv'] downloaded from [''] at ['2023-02-02 18:39:05']

GISTEMP

Original data file (external link)

Citation: Lenssen, N., G. Schmidt, J. Hansen, M. Menne, A. Persin, R. Ruedy, and D. Zyss, 2019: Improvements in the GISTEMP uncertainty model. J. Geophys. Res. Atmos., 124, no. 12, 6307-6326, doi:10.1029/2018JD029522.

Data citation: GISTEMP Team, 2022: GISS Surface Temperature Analysis (GISTEMP), version 4. NASA Goddard Institute for Space Studies. Dataset accessed 2023-02-02 09:18:24 at data.giss.nasa.gov/gistemp/.

To produce the plot, the following processing steps were performed:

  • "Data set created from file ['gistemp1200_GHCNv4_ERSSTv5.nc.gz'] downloaded from ['https://data.giss.nasa.gov/pub/gistemp/gistemp1200_GHCNv4_ERSSTv5.nc.gz'] at ['2023-02-02 09:18:24']"
  • "Regridded to 1 degree latitude-longitude resolution"
  • "Rebaselined to 1991-2020"
  • "Calculated area-average"
  • "Calculated annual average from monthly averages using arithmetic mean"
  • "Selected years within the range 1900 to 2022."
  • "Wrote to file wmo_ra_3_GISTEMP.csv"
  • Data set created from file ['wmo_ra_3_GISTEMP.csv'] downloaded from [''] at ['2023-02-02 18:39:20']

HadCRUT5

Original data file (external link)

Citation: Morice, C. P., Kennedy, J. J., Rayner, N. A., Winn, J. P., Hogan, E., Killick, R. E., et al. (2021). An updated assessment of near-surface temperature change from 1850: the HadCRUT5 data set. Journal of Geophysical Research: Atmospheres, 126, e2019JD032361. https://doi.org/10.1029/2019JD032361.

Acknowledgement: HadCRUT.5.0.1.0 data were obtained from http://www.metoffice.gov.uk/hadobs/hadcrut5 on 2023-02-02 09:18:25 and are © British Crown Copyright, Met Office 2023, provided under an Open Government License, http://www.nationalarchives.gov.uk/doc/open-government-licence/version/3/

To produce the plot, the following processing steps were performed:

  • "Data set created from file ['HadCRUT.5.0.1.0.analysis.anomalies.ensemble_mean.nc'] downloaded from ['https://www.metoffice.gov.uk/hadobs/hadcrut5/data/current/analysis/HadCRUT.5.0.1.0.analysis.anomalies.ensemble_mean.nc'] at ['2023-02-02 09:18:25']"
  • "Regridded to 1 degree latitude-longitude resolution"
  • "Rebaselined to 1991-2020"
  • "Calculated area-average"
  • "Calculated annual average from monthly averages using arithmetic mean"
  • "Selected years within the range 1900 to 2022."
  • "Wrote to file wmo_ra_3_HadCRUT5.csv"
  • Data set created from file ['wmo_ra_3_HadCRUT5.csv'] downloaded from [''] at ['2023-02-02 18:39:48']

JRA-55

Original data file (external link)

Citation: Kobayashi, S., Ota, Y., Harada, Y., Ebita, A., Moriya, M., Onoda, H., Onogi, K., Kamahori, H., Kobayashi, C., Endo, H. and Miyaoka, K., (2015). The JRA-55 reanalysis: General specifications and basic characteristics. Journal of the Meteorological Society of Japan. Ser. II, 93(1), pp.5-48..

To produce the plot, the following processing steps were performed:

  • "Data set created from file ['anl_surf125.011_tmp.202301_202312', 'anl_surf125.2023MMMM'] downloaded from ['', ''] at ['2023-01-09 09:22:14']"
  • "Regridded to 1 degree latitude-longitude resolution"
  • "Rebaselined to 1991-2020"
  • "Calculated area-average"
  • "Calculated annual average from monthly averages using arithmetic mean"
  • "Selected years within the range 1900 to 2022."
  • "Wrote to file wmo_ra_3_JRA-55.csv"
  • Data set created from file ['wmo_ra_3_JRA-55.csv'] downloaded from [''] at ['2023-02-02 18:40:22']

NOAAGlobalTemp

Original data file (external link)

Citations: Huang, B., M. J. Menne, T. Boyer, E. Freeman, B. E. Gleason, J. H. Lawrimore, C. Liu, J. J. Rennie, C. Schreck, F. Sun, R. Vose, C. N. Williams, X. Yin, H.-M. Zhang, 2020: Uncertainty estimates for sea surface temperature and land surface air temperature in NOAAGlobalTemp version 5. , J. Climate, 33, 1351-1379, DOI: 10.1175/JCLI-D-19-0395.1. Zhang, Huai-Min, Jay H. Lawrimore, Boyin Huang, Matthew J. Menne, Xungang Yin, Ahira Sȧnchez-Lugo, Byron E. Gleason, Russell Vose, Derek Arndt, J. Jared Rennie, and Claude N. Williams. (2019) Updated Temperature Data Give a Sharper View of Climate Trends. Eos, 100, https://doi.org/10.1029/2019EO128229.

Data citation: Zhang, H.-M., B. Huang, J. Lawrimore, M. Menne, Thomas M. Smith, NOAA Global Surface Temperature Dataset (NOAAGlobalTemp), Version 5 [indicate subset used]. NOAA National Centers for Environmental Information. doi:10.25921/9qth-2p70 Accessed [2023-02-02 09:18:32].

To produce the plot, the following processing steps were performed:

  • "Data set created from file ['NOAAGlobalTemp_v*.nc'] downloaded from ['https://www.ncei.noaa.gov/data/noaa-global-surface-temperature/v5/access/gridded/NOAAGlobalTemp_v.*.nc'] at ['2023-02-02 09:18:32']"
  • "Data set created from file ['NOAAGlobalTemp_v*.nc'] downloaded from ['https://www.ncei.noaa.gov/data/noaa-global-surface-temperature/v5/access/gridded/NOAAGlobalTemp_v.*.nc'] at ['2023-02-02 09:18:32']"
  • "Regridded to 1 degree latitude-longitude resolution"
  • "Rebaselined to 1991-2020"
  • "Calculated area-average"
  • "Calculated annual average from monthly averages using arithmetic mean"
  • "Selected years within the range 1900 to 2022."
  • "Wrote to file wmo_ra_3_NOAAGlobalTemp.csv"
  • Data set created from file ['wmo_ra_3_NOAAGlobalTemp.csv'] downloaded from [''] at ['2023-02-02 18:40:42']

WMO RA IV North America

The data in the above plot are available in a zip file containing a csv file for each data set.

Data file: WMO_RA_IV_North_America_data_files.zip
Checksum: 395a691a7fcba8a277cd3b7154af04a5
Format: BADC CSV format

Berkeley Earth

Original data file (external link)

Citation: Rohde, R. A. and Hausfather, Z.: The Berkeley Earth Land/Ocean Temperature Record, Earth Syst. Sci. Data, 12, 3469-3479, https://doi.org/10.5194/essd-12-3469-2020, 2020.

To produce the plot, the following processing steps were performed:

  • "Data set created from file ['Land_and_Ocean_LatLong1.nc'] downloaded from ['http://berkeleyearth.lbl.gov/auto/Global/Gridded/Land_and_Ocean_LatLong1.nc'] at ['2023-02-02 09:17:44']"
  • "Rebaselined to 1991-2020"
  • "Calculated area-average"
  • "Calculated annual average from monthly averages using arithmetic mean"
  • "Selected years within the range 1900 to 2022."
  • "Wrote to file wmo_ra_4_Berkeley Earth.csv"
  • Data set created from file ['wmo_ra_4_Berkeley Earth.csv'] downloaded from [''] at ['2023-02-02 18:38:32']

ERA5

Original data file (external link)

Citation: Hersbach H, Bell B, Berrisford P et al. 2020. The ERA5 global reanalysis. Q. J. R. Meteorol. Soc. 146: 1999-2049. https://doi.org/10.1002/qj.3803.

To produce the plot, the following processing steps were performed:

  • "Gridded dataset created from file ['era5_2m_tas_2023.nc'] downloaded from ['']"
  • "Regridded to 1 degree latitude-longitude resolution"
  • "Rebaselined to 1991-2020"
  • "Calculated area-average"
  • "Calculated annual average from monthly averages using arithmetic mean"
  • "Selected years within the range 1900 to 2022."
  • "Wrote to file wmo_ra_4_ERA5.csv"
  • Data set created from file ['wmo_ra_4_ERA5.csv'] downloaded from [''] at ['2023-02-02 18:39:06']

GISTEMP

Original data file (external link)

Citation: Lenssen, N., G. Schmidt, J. Hansen, M. Menne, A. Persin, R. Ruedy, and D. Zyss, 2019: Improvements in the GISTEMP uncertainty model. J. Geophys. Res. Atmos., 124, no. 12, 6307-6326, doi:10.1029/2018JD029522.

Data citation: GISTEMP Team, 2022: GISS Surface Temperature Analysis (GISTEMP), version 4. NASA Goddard Institute for Space Studies. Dataset accessed 2023-02-02 09:18:24 at data.giss.nasa.gov/gistemp/.

To produce the plot, the following processing steps were performed:

  • "Data set created from file ['gistemp1200_GHCNv4_ERSSTv5.nc.gz'] downloaded from ['https://data.giss.nasa.gov/pub/gistemp/gistemp1200_GHCNv4_ERSSTv5.nc.gz'] at ['2023-02-02 09:18:24']"
  • "Regridded to 1 degree latitude-longitude resolution"
  • "Rebaselined to 1991-2020"
  • "Calculated area-average"
  • "Calculated annual average from monthly averages using arithmetic mean"
  • "Selected years within the range 1900 to 2022."
  • "Wrote to file wmo_ra_4_GISTEMP.csv"
  • Data set created from file ['wmo_ra_4_GISTEMP.csv'] downloaded from [''] at ['2023-02-02 18:39:21']

HadCRUT5

Original data file (external link)

Citation: Morice, C. P., Kennedy, J. J., Rayner, N. A., Winn, J. P., Hogan, E., Killick, R. E., et al. (2021). An updated assessment of near-surface temperature change from 1850: the HadCRUT5 data set. Journal of Geophysical Research: Atmospheres, 126, e2019JD032361. https://doi.org/10.1029/2019JD032361.

Acknowledgement: HadCRUT.5.0.1.0 data were obtained from http://www.metoffice.gov.uk/hadobs/hadcrut5 on 2023-02-02 09:18:25 and are © British Crown Copyright, Met Office 2023, provided under an Open Government License, http://www.nationalarchives.gov.uk/doc/open-government-licence/version/3/

To produce the plot, the following processing steps were performed:

  • "Data set created from file ['HadCRUT.5.0.1.0.analysis.anomalies.ensemble_mean.nc'] downloaded from ['https://www.metoffice.gov.uk/hadobs/hadcrut5/data/current/analysis/HadCRUT.5.0.1.0.analysis.anomalies.ensemble_mean.nc'] at ['2023-02-02 09:18:25']"
  • "Regridded to 1 degree latitude-longitude resolution"
  • "Rebaselined to 1991-2020"
  • "Calculated area-average"
  • "Calculated annual average from monthly averages using arithmetic mean"
  • "Selected years within the range 1900 to 2022."
  • "Wrote to file wmo_ra_4_HadCRUT5.csv"
  • Data set created from file ['wmo_ra_4_HadCRUT5.csv'] downloaded from [''] at ['2023-02-02 18:39:50']

JRA-55

Original data file (external link)

Citation: Kobayashi, S., Ota, Y., Harada, Y., Ebita, A., Moriya, M., Onoda, H., Onogi, K., Kamahori, H., Kobayashi, C., Endo, H. and Miyaoka, K., (2015). The JRA-55 reanalysis: General specifications and basic characteristics. Journal of the Meteorological Society of Japan. Ser. II, 93(1), pp.5-48..

To produce the plot, the following processing steps were performed:

  • "Data set created from file ['anl_surf125.011_tmp.202301_202312', 'anl_surf125.2023MMMM'] downloaded from ['', ''] at ['2023-01-09 09:22:14']"
  • "Regridded to 1 degree latitude-longitude resolution"
  • "Rebaselined to 1991-2020"
  • "Calculated area-average"
  • "Calculated annual average from monthly averages using arithmetic mean"
  • "Selected years within the range 1900 to 2022."
  • "Wrote to file wmo_ra_4_JRA-55.csv"
  • Data set created from file ['wmo_ra_4_JRA-55.csv'] downloaded from [''] at ['2023-02-02 18:40:23']

NOAAGlobalTemp

Original data file (external link)

Citations: Huang, B., M. J. Menne, T. Boyer, E. Freeman, B. E. Gleason, J. H. Lawrimore, C. Liu, J. J. Rennie, C. Schreck, F. Sun, R. Vose, C. N. Williams, X. Yin, H.-M. Zhang, 2020: Uncertainty estimates for sea surface temperature and land surface air temperature in NOAAGlobalTemp version 5. , J. Climate, 33, 1351-1379, DOI: 10.1175/JCLI-D-19-0395.1. Zhang, Huai-Min, Jay H. Lawrimore, Boyin Huang, Matthew J. Menne, Xungang Yin, Ahira Sȧnchez-Lugo, Byron E. Gleason, Russell Vose, Derek Arndt, J. Jared Rennie, and Claude N. Williams. (2019) Updated Temperature Data Give a Sharper View of Climate Trends. Eos, 100, https://doi.org/10.1029/2019EO128229.

Data citation: Zhang, H.-M., B. Huang, J. Lawrimore, M. Menne, Thomas M. Smith, NOAA Global Surface Temperature Dataset (NOAAGlobalTemp), Version 5 [indicate subset used]. NOAA National Centers for Environmental Information. doi:10.25921/9qth-2p70 Accessed [2023-02-02 09:18:32].

To produce the plot, the following processing steps were performed:

  • "Data set created from file ['NOAAGlobalTemp_v*.nc'] downloaded from ['https://www.ncei.noaa.gov/data/noaa-global-surface-temperature/v5/access/gridded/NOAAGlobalTemp_v.*.nc'] at ['2023-02-02 09:18:32']"
  • "Data set created from file ['NOAAGlobalTemp_v*.nc'] downloaded from ['https://www.ncei.noaa.gov/data/noaa-global-surface-temperature/v5/access/gridded/NOAAGlobalTemp_v.*.nc'] at ['2023-02-02 09:18:32']"
  • "Regridded to 1 degree latitude-longitude resolution"
  • "Rebaselined to 1991-2020"
  • "Calculated area-average"
  • "Calculated annual average from monthly averages using arithmetic mean"
  • "Selected years within the range 1900 to 2022."
  • "Wrote to file wmo_ra_4_NOAAGlobalTemp.csv"
  • Data set created from file ['wmo_ra_4_NOAAGlobalTemp.csv'] downloaded from [''] at ['2023-02-02 18:40:43']

WMO RA V Southwest Pacific

The data in the above plot are available in a zip file containing a csv file for each data set.

Data file: WMO_RA_V_Southwest_Pacific_data_files.zip
Checksum: b93481db2dfc12bfa77dde7747619c84
Format: BADC CSV format

Berkeley Earth

Original data file (external link)

Citation: Rohde, R. A. and Hausfather, Z.: The Berkeley Earth Land/Ocean Temperature Record, Earth Syst. Sci. Data, 12, 3469-3479, https://doi.org/10.5194/essd-12-3469-2020, 2020.

To produce the plot, the following processing steps were performed:

  • "Data set created from file ['Land_and_Ocean_LatLong1.nc'] downloaded from ['http://berkeleyearth.lbl.gov/auto/Global/Gridded/Land_and_Ocean_LatLong1.nc'] at ['2023-02-02 09:17:44']"
  • "Rebaselined to 1991-2020"
  • "Calculated area-average"
  • "Calculated annual average from monthly averages using arithmetic mean"
  • "Selected years within the range 1900 to 2022."
  • "Wrote to file wmo_ra_5_Berkeley Earth.csv"
  • Data set created from file ['wmo_ra_5_Berkeley Earth.csv'] downloaded from [''] at ['2023-02-02 18:38:34']

ERA5

Original data file (external link)

Citation: Hersbach H, Bell B, Berrisford P et al. 2020. The ERA5 global reanalysis. Q. J. R. Meteorol. Soc. 146: 1999-2049. https://doi.org/10.1002/qj.3803.

To produce the plot, the following processing steps were performed:

  • "Gridded dataset created from file ['era5_2m_tas_2023.nc'] downloaded from ['']"
  • "Regridded to 1 degree latitude-longitude resolution"
  • "Rebaselined to 1991-2020"
  • "Calculated area-average"
  • "Calculated annual average from monthly averages using arithmetic mean"
  • "Selected years within the range 1900 to 2022."
  • "Wrote to file wmo_ra_5_ERA5.csv"
  • Data set created from file ['wmo_ra_5_ERA5.csv'] downloaded from [''] at ['2023-02-02 18:39:06']

GISTEMP

Original data file (external link)

Citation: Lenssen, N., G. Schmidt, J. Hansen, M. Menne, A. Persin, R. Ruedy, and D. Zyss, 2019: Improvements in the GISTEMP uncertainty model. J. Geophys. Res. Atmos., 124, no. 12, 6307-6326, doi:10.1029/2018JD029522.

Data citation: GISTEMP Team, 2022: GISS Surface Temperature Analysis (GISTEMP), version 4. NASA Goddard Institute for Space Studies. Dataset accessed 2023-02-02 09:18:24 at data.giss.nasa.gov/gistemp/.

To produce the plot, the following processing steps were performed:

  • "Data set created from file ['gistemp1200_GHCNv4_ERSSTv5.nc.gz'] downloaded from ['https://data.giss.nasa.gov/pub/gistemp/gistemp1200_GHCNv4_ERSSTv5.nc.gz'] at ['2023-02-02 09:18:24']"
  • "Regridded to 1 degree latitude-longitude resolution"
  • "Rebaselined to 1991-2020"
  • "Calculated area-average"
  • "Calculated annual average from monthly averages using arithmetic mean"
  • "Selected years within the range 1900 to 2022."
  • "Wrote to file wmo_ra_5_GISTEMP.csv"
  • Data set created from file ['wmo_ra_5_GISTEMP.csv'] downloaded from [''] at ['2023-02-02 18:39:22']

HadCRUT5

Original data file (external link)

Citation: Morice, C. P., Kennedy, J. J., Rayner, N. A., Winn, J. P., Hogan, E., Killick, R. E., et al. (2021). An updated assessment of near-surface temperature change from 1850: the HadCRUT5 data set. Journal of Geophysical Research: Atmospheres, 126, e2019JD032361. https://doi.org/10.1029/2019JD032361.

Acknowledgement: HadCRUT.5.0.1.0 data were obtained from http://www.metoffice.gov.uk/hadobs/hadcrut5 on 2023-02-02 09:18:25 and are © British Crown Copyright, Met Office 2023, provided under an Open Government License, http://www.nationalarchives.gov.uk/doc/open-government-licence/version/3/

To produce the plot, the following processing steps were performed:

  • "Data set created from file ['HadCRUT.5.0.1.0.analysis.anomalies.ensemble_mean.nc'] downloaded from ['https://www.metoffice.gov.uk/hadobs/hadcrut5/data/current/analysis/HadCRUT.5.0.1.0.analysis.anomalies.ensemble_mean.nc'] at ['2023-02-02 09:18:25']"
  • "Regridded to 1 degree latitude-longitude resolution"
  • "Rebaselined to 1991-2020"
  • "Calculated area-average"
  • "Calculated annual average from monthly averages using arithmetic mean"
  • "Selected years within the range 1900 to 2022."
  • "Wrote to file wmo_ra_5_HadCRUT5.csv"
  • Data set created from file ['wmo_ra_5_HadCRUT5.csv'] downloaded from [''] at ['2023-02-02 18:39:52']

JRA-55

Original data file (external link)

Citation: Kobayashi, S., Ota, Y., Harada, Y., Ebita, A., Moriya, M., Onoda, H., Onogi, K., Kamahori, H., Kobayashi, C., Endo, H. and Miyaoka, K., (2015). The JRA-55 reanalysis: General specifications and basic characteristics. Journal of the Meteorological Society of Japan. Ser. II, 93(1), pp.5-48..

To produce the plot, the following processing steps were performed:

  • "Data set created from file ['anl_surf125.011_tmp.202301_202312', 'anl_surf125.2023MMMM'] downloaded from ['', ''] at ['2023-01-09 09:22:14']"
  • "Regridded to 1 degree latitude-longitude resolution"
  • "Rebaselined to 1991-2020"
  • "Calculated area-average"
  • "Calculated annual average from monthly averages using arithmetic mean"
  • "Selected years within the range 1900 to 2022."
  • "Wrote to file wmo_ra_5_JRA-55.csv"
  • Data set created from file ['wmo_ra_5_JRA-55.csv'] downloaded from [''] at ['2023-02-02 18:40:24']

NOAAGlobalTemp

Original data file (external link)

Citations: Huang, B., M. J. Menne, T. Boyer, E. Freeman, B. E. Gleason, J. H. Lawrimore, C. Liu, J. J. Rennie, C. Schreck, F. Sun, R. Vose, C. N. Williams, X. Yin, H.-M. Zhang, 2020: Uncertainty estimates for sea surface temperature and land surface air temperature in NOAAGlobalTemp version 5. , J. Climate, 33, 1351-1379, DOI: 10.1175/JCLI-D-19-0395.1. Zhang, Huai-Min, Jay H. Lawrimore, Boyin Huang, Matthew J. Menne, Xungang Yin, Ahira Sȧnchez-Lugo, Byron E. Gleason, Russell Vose, Derek Arndt, J. Jared Rennie, and Claude N. Williams. (2019) Updated Temperature Data Give a Sharper View of Climate Trends. Eos, 100, https://doi.org/10.1029/2019EO128229.

Data citation: Zhang, H.-M., B. Huang, J. Lawrimore, M. Menne, Thomas M. Smith, NOAA Global Surface Temperature Dataset (NOAAGlobalTemp), Version 5 [indicate subset used]. NOAA National Centers for Environmental Information. doi:10.25921/9qth-2p70 Accessed [2023-02-02 09:18:32].

To produce the plot, the following processing steps were performed:

  • "Data set created from file ['NOAAGlobalTemp_v*.nc'] downloaded from ['https://www.ncei.noaa.gov/data/noaa-global-surface-temperature/v5/access/gridded/NOAAGlobalTemp_v.*.nc'] at ['2023-02-02 09:18:32']"
  • "Data set created from file ['NOAAGlobalTemp_v*.nc'] downloaded from ['https://www.ncei.noaa.gov/data/noaa-global-surface-temperature/v5/access/gridded/NOAAGlobalTemp_v.*.nc'] at ['2023-02-02 09:18:32']"
  • "Regridded to 1 degree latitude-longitude resolution"
  • "Rebaselined to 1991-2020"
  • "Calculated area-average"
  • "Calculated annual average from monthly averages using arithmetic mean"
  • "Selected years within the range 1900 to 2022."
  • "Wrote to file wmo_ra_5_NOAAGlobalTemp.csv"
  • Data set created from file ['wmo_ra_5_NOAAGlobalTemp.csv'] downloaded from [''] at ['2023-02-02 18:40:45']

WMO RA VI Europe

The data in the above plot are available in a zip file containing a csv file for each data set.

Data file: WMO_RA_VI_Europe_data_files.zip
Checksum: 6da3dba8741be99d884d1af3df05a744
Format: BADC CSV format

Berkeley Earth

Original data file (external link)

Citation: Rohde, R. A. and Hausfather, Z.: The Berkeley Earth Land/Ocean Temperature Record, Earth Syst. Sci. Data, 12, 3469-3479, https://doi.org/10.5194/essd-12-3469-2020, 2020.

To produce the plot, the following processing steps were performed:

  • "Data set created from file ['Land_and_Ocean_LatLong1.nc'] downloaded from ['http://berkeleyearth.lbl.gov/auto/Global/Gridded/Land_and_Ocean_LatLong1.nc'] at ['2023-02-02 09:17:44']"
  • "Rebaselined to 1991-2020"
  • "Calculated area-average"
  • "Calculated annual average from monthly averages using arithmetic mean"
  • "Selected years within the range 1900 to 2022."
  • "Wrote to file wmo_ra_6_Berkeley Earth.csv"
  • Data set created from file ['wmo_ra_6_Berkeley Earth.csv'] downloaded from [''] at ['2023-02-02 18:38:36']

ERA5

Original data file (external link)

Citation: Hersbach H, Bell B, Berrisford P et al. 2020. The ERA5 global reanalysis. Q. J. R. Meteorol. Soc. 146: 1999-2049. https://doi.org/10.1002/qj.3803.

To produce the plot, the following processing steps were performed:

  • "Gridded dataset created from file ['era5_2m_tas_2023.nc'] downloaded from ['']"
  • "Regridded to 1 degree latitude-longitude resolution"
  • "Rebaselined to 1991-2020"
  • "Calculated area-average"
  • "Calculated annual average from monthly averages using arithmetic mean"
  • "Selected years within the range 1900 to 2022."
  • "Wrote to file wmo_ra_6_ERA5.csv"
  • Data set created from file ['wmo_ra_6_ERA5.csv'] downloaded from [''] at ['2023-02-02 18:39:07']

GISTEMP

Original data file (external link)

Citation: Lenssen, N., G. Schmidt, J. Hansen, M. Menne, A. Persin, R. Ruedy, and D. Zyss, 2019: Improvements in the GISTEMP uncertainty model. J. Geophys. Res. Atmos., 124, no. 12, 6307-6326, doi:10.1029/2018JD029522.

Data citation: GISTEMP Team, 2022: GISS Surface Temperature Analysis (GISTEMP), version 4. NASA Goddard Institute for Space Studies. Dataset accessed 2023-02-02 09:18:24 at data.giss.nasa.gov/gistemp/.

To produce the plot, the following processing steps were performed:

  • "Data set created from file ['gistemp1200_GHCNv4_ERSSTv5.nc.gz'] downloaded from ['https://data.giss.nasa.gov/pub/gistemp/gistemp1200_GHCNv4_ERSSTv5.nc.gz'] at ['2023-02-02 09:18:24']"
  • "Regridded to 1 degree latitude-longitude resolution"
  • "Rebaselined to 1991-2020"
  • "Calculated area-average"
  • "Calculated annual average from monthly averages using arithmetic mean"
  • "Selected years within the range 1900 to 2022."
  • "Wrote to file wmo_ra_6_GISTEMP.csv"
  • Data set created from file ['wmo_ra_6_GISTEMP.csv'] downloaded from [''] at ['2023-02-02 18:39:23']

HadCRUT5

Original data file (external link)

Citation: Morice, C. P., Kennedy, J. J., Rayner, N. A., Winn, J. P., Hogan, E., Killick, R. E., et al. (2021). An updated assessment of near-surface temperature change from 1850: the HadCRUT5 data set. Journal of Geophysical Research: Atmospheres, 126, e2019JD032361. https://doi.org/10.1029/2019JD032361.

Acknowledgement: HadCRUT.5.0.1.0 data were obtained from http://www.metoffice.gov.uk/hadobs/hadcrut5 on 2023-02-02 09:18:25 and are © British Crown Copyright, Met Office 2023, provided under an Open Government License, http://www.nationalarchives.gov.uk/doc/open-government-licence/version/3/

To produce the plot, the following processing steps were performed:

  • "Data set created from file ['HadCRUT.5.0.1.0.analysis.anomalies.ensemble_mean.nc'] downloaded from ['https://www.metoffice.gov.uk/hadobs/hadcrut5/data/current/analysis/HadCRUT.5.0.1.0.analysis.anomalies.ensemble_mean.nc'] at ['2023-02-02 09:18:25']"
  • "Regridded to 1 degree latitude-longitude resolution"
  • "Rebaselined to 1991-2020"
  • "Calculated area-average"
  • "Calculated annual average from monthly averages using arithmetic mean"
  • "Selected years within the range 1900 to 2022."
  • "Wrote to file wmo_ra_6_HadCRUT5.csv"
  • Data set created from file ['wmo_ra_6_HadCRUT5.csv'] downloaded from [''] at ['2023-02-02 18:39:54']

JRA-55

Original data file (external link)

Citation: Kobayashi, S., Ota, Y., Harada, Y., Ebita, A., Moriya, M., Onoda, H., Onogi, K., Kamahori, H., Kobayashi, C., Endo, H. and Miyaoka, K., (2015). The JRA-55 reanalysis: General specifications and basic characteristics. Journal of the Meteorological Society of Japan. Ser. II, 93(1), pp.5-48..

To produce the plot, the following processing steps were performed:

  • "Data set created from file ['anl_surf125.011_tmp.202301_202312', 'anl_surf125.2023MMMM'] downloaded from ['', ''] at ['2023-01-09 09:22:14']"
  • "Regridded to 1 degree latitude-longitude resolution"
  • "Rebaselined to 1991-2020"
  • "Calculated area-average"
  • "Calculated annual average from monthly averages using arithmetic mean"
  • "Selected years within the range 1900 to 2022."
  • "Wrote to file wmo_ra_6_JRA-55.csv"
  • Data set created from file ['wmo_ra_6_JRA-55.csv'] downloaded from [''] at ['2023-02-02 18:40:25']

NOAAGlobalTemp

Original data file (external link)

Citations: Huang, B., M. J. Menne, T. Boyer, E. Freeman, B. E. Gleason, J. H. Lawrimore, C. Liu, J. J. Rennie, C. Schreck, F. Sun, R. Vose, C. N. Williams, X. Yin, H.-M. Zhang, 2020: Uncertainty estimates for sea surface temperature and land surface air temperature in NOAAGlobalTemp version 5. , J. Climate, 33, 1351-1379, DOI: 10.1175/JCLI-D-19-0395.1. Zhang, Huai-Min, Jay H. Lawrimore, Boyin Huang, Matthew J. Menne, Xungang Yin, Ahira Sȧnchez-Lugo, Byron E. Gleason, Russell Vose, Derek Arndt, J. Jared Rennie, and Claude N. Williams. (2019) Updated Temperature Data Give a Sharper View of Climate Trends. Eos, 100, https://doi.org/10.1029/2019EO128229.

Data citation: Zhang, H.-M., B. Huang, J. Lawrimore, M. Menne, Thomas M. Smith, NOAA Global Surface Temperature Dataset (NOAAGlobalTemp), Version 5 [indicate subset used]. NOAA National Centers for Environmental Information. doi:10.25921/9qth-2p70 Accessed [2023-02-02 09:18:32].

To produce the plot, the following processing steps were performed:

  • "Data set created from file ['NOAAGlobalTemp_v*.nc'] downloaded from ['https://www.ncei.noaa.gov/data/noaa-global-surface-temperature/v5/access/gridded/NOAAGlobalTemp_v.*.nc'] at ['2023-02-02 09:18:32']"
  • "Data set created from file ['NOAAGlobalTemp_v*.nc'] downloaded from ['https://www.ncei.noaa.gov/data/noaa-global-surface-temperature/v5/access/gridded/NOAAGlobalTemp_v.*.nc'] at ['2023-02-02 09:18:32']"
  • "Regridded to 1 degree latitude-longitude resolution"
  • "Rebaselined to 1991-2020"
  • "Calculated area-average"
  • "Calculated annual average from monthly averages using arithmetic mean"
  • "Selected years within the range 1900 to 2022."
  • "Wrote to file wmo_ra_6_NOAAGlobalTemp.csv"
  • Data set created from file ['wmo_ra_6_NOAAGlobalTemp.csv'] downloaded from [''] at ['2023-02-02 18:40:46']

Page created on 2023-02-03 using climind v0.1

Anim pariatur cliche reprehenderit, enim eiusmod high life accusamus terry richardson ad squid. 3 wolf moon officia aute, non cupidatat skateboard dolor brunch. Food truck quinoa nesciunt laborum eiusmod. Brunch 3 wolf moon tempor, sunt aliqua put a bird on it squid single-origin coffee nulla assumenda shoreditch et. Nihil anim keffiyeh helvetica, craft beer labore wes anderson cred nesciunt sapiente ea proident. Ad vegan excepteur butcher vice lomo. Leggings occaecat craft beer farm-to-table, raw denim aesthetic synth nesciunt you probably haven't heard of them accusamus labore sustainable VHS.

Anim pariatur cliche reprehenderit, enim eiusmod high life accusamus terry richardson ad squid. 3 wolf moon officia aute, non cupidatat skateboard dolor brunch. Food truck quinoa nesciunt laborum eiusmod. Brunch 3 wolf moon tempor, sunt aliqua put a bird on it squid single-origin coffee nulla assumenda shoreditch et. Nihil anim keffiyeh helvetica, craft beer labore wes anderson cred nesciunt sapiente ea proident. Ad vegan excepteur butcher vice lomo. Leggings occaecat craft beer farm-to-table, raw denim aesthetic synth nesciunt you probably haven't heard of them accusamus labore sustainable VHS.

Anim pariatur cliche reprehenderit, enim eiusmod high life accusamus terry richardson ad squid. 3 wolf moon officia aute, non cupidatat skateboard dolor brunch. Food truck quinoa nesciunt laborum eiusmod. Brunch 3 wolf moon tempor, sunt aliqua put a bird on it squid single-origin coffee nulla assumenda shoreditch et. Nihil anim keffiyeh helvetica, craft beer labore wes anderson cred nesciunt sapiente ea proident. Ad vegan excepteur butcher vice lomo. Leggings occaecat craft beer farm-to-table, raw denim aesthetic synth nesciunt you probably haven't heard of them accusamus labore sustainable VHS.
Back to top